Data Analysis: The Complete 2026 Guide
By the InfiniSynapse Data Team · Last updated: 2026-07-09 · We build an AI-native data analysis platform, and this guide reflects how the discipline actually works in 2026, grounded in building agents on real customer data.
Table of Contents
- TL;DR
- How We Evaluated Data Analysis
- What Data Analysis Is
- Why It Matters in 2026
- The Four Types
- The Process, Step by Step
- Methods and Techniques
- The Tools Landscape
- The Shift to AI-Native Workflows
- How to Get Started
- Common Failure Modes
- Cluster Guides in This Pillar
- Fundamentals Readiness Scorecard
- Frequently Asked Questions
- Conclusion
TL;DR
Direct answer: data analysis is the disciplined process of inspecting, cleaning, transforming, and modeling data to surface useful information and support decisions. It divides into four types (descriptive, diagnostic, predictive, prescriptive), follows a repeatable six-step process, and in 2026 is increasingly performed by AI-native agents that automate mechanical steps while humans focus on judgment.
Who this is for: anyone learning data analysis from the ground up, or seeking a structured overview of the whole discipline.
What you'll learn: how we evaluated the field, a precise definition, why it matters now, the four types, the step-by-step process, methods and tools, and how AI is changing the practice.
This hub maps the fundamentals pillar. For a beginner introduction, see what is data analysis; for a formal definition, see data analysis definition. For plain-English meaning, see data analysis meaning.
How We Evaluated Data Analysis
We assessed the discipline for this guide using criteria that mirror how production teams and educators frame analytical work, not buzzword popularity alone. Each framework element was checked against four dimensions: whether it matches authoritative definitions, whether it maps to repeatable workflows, whether it scales from spreadsheet work to warehouse-scale queries, and whether it acknowledges how AI-assisted tooling changed daily practice in 2026.
We cross-referenced the underlying activity with the Wikipedia overview of data analysis, which frames analysis as inspecting, cleaning, transforming, and modeling data to surface useful information. We aligned autonomy expectations with IBM's augmented analytics overview, which tracks how AI-assisted workflows reshape what teams expect from analytical tooling. The Stanford HAI AI Index documents how quickly agent-assisted analysis moved from research into production roles. For labor-market context we referenced the Bureau of Labor Statistics occupational profile for data analysts, which lists inspection, cleaning, and interpretation as core daily tasks.
The table below summarizes the evaluation dimensions we apply when recommending analytical approaches to a team or learner.
| Evaluation dimension | Why it matters in 2026 | Authoritative reference |
|---|---|---|
| Definition clarity | Shared vocabulary prevents wasted effort | Wikipedia data analysis |
| Process repeatability | Messy data rewards disciplined stages | IBM augmented analytics |
| Type framework | Question type drives method choice | NIST Big Data overview |
| Tool fit | Scale and recurrence determine tooling | Google Cloud AI overview |
| Labor relevance | Skills must match hiring expectations | BLS data analysts profile |
| AI maturity | Agents automate routine steps | Stanford HAI AI Index |
| Communication | Insight without narrative changes no decision | Harvard Business Review skills-based hiring |
| Governance | Multi-source work needs audit trails | OECD AI adoption overview |
What Data Analysis Is
At its core, analysis is the practice of turning raw data into useful information that supports a decision. It encompasses gathering data, cleaning it into a trustworthy form, exploring and transforming it, applying methods to find patterns, and communicating what those patterns mean. The discipline spans everything from a quick spreadsheet calculation to a federated query across billions of rows.
Key Definition: data analysis is the systematic process of inspecting, cleaning, transforming, and modeling data with the goal of discovering useful information, informing conclusions, and supporting decision-making.
This definition, consistent with the Wikipedia overview of data analysis, emphasizes that analysis is a process rather than a single act. If you are entirely new to the concept, our companion guide on what is data analysis offers a gentle beginner's introduction, while data analysis definition provides a more formal treatment. The essential idea is that analysis converts an overwhelming volume of numbers into a small number of actionable insights.
Why It Matters in 2026
The importance of analytical skill has only grown as organizations collect ever more data than they can interpret unaided. Every business decision, from pricing to product to hiring, can now be informed by data, and the organizations that analyze well outcompete those that guess. This is why analytical skills are in broad demand and why the discipline sits at the center of modern operations.
What is distinctive about the discipline in 2026 is the arrival of AI-native tools that automate much of the mechanical work. The Stanford HAI AI Index documents how quickly autonomous, agentic capabilities moved from research into production, and Google Cloud's AI overview tracks the same shift in the enterprise. The result is that the practice is becoming more accessible and more powerful at once, which raises rather than lowers the value of understanding the fundamentals this guide covers.
The Four Types
A foundational framework divides analytical work into four types by the question each answers. Descriptive analysis asks what happened, summarizing past data into understandable form. Diagnostic analysis asks why it happened, digging into causes. Predictive analysis asks what will happen, using patterns to forecast. Prescriptive analysis asks what we should do, recommending actions based on the analysis.
These four types build on one another in increasing sophistication, and we explore them in depth in types of data analysis. Most everyday work is descriptive and diagnostic, answering what happened and why, while predictive and prescriptive analysis require more advanced methods. Understanding which type a question calls for is the first step to choosing the right approach, because applying a predictive method to a descriptive question, or vice versa, wastes effort and can mislead.
| Analysis type | Question answered | Typical methods | Example use |
|---|---|---|---|
| Descriptive | What happened? | Summaries, trends, dashboards | Monthly revenue report |
| Diagnostic | Why did it happen? | Drill-down, cohort comparison | Churn spike root cause |
| Predictive | What will happen? | Regression, forecasting | Next-quarter demand |
| Prescriptive | What should we do? | Optimization, simulation | Pricing recommendation |
The Process, Step by Step
Regardless of type, rigorous analysis follows a repeatable process. First, define the question clearly, since a vague question produces a useless answer. Second, gather the relevant data from the appropriate sources. Third, clean the data, resolving duplicates, inconsistent formats, and missing values so the analysis rests on trustworthy input. This cleaning stage often consumes the most time.
Fourth, explore and analyze the data using appropriate methods. Fifth, interpret the results, judging what they mean and whether they make sense. Sixth, communicate the findings clearly to those who will act on them. We detail each stage in the data analysis process. This six-step process applies whether the work is a quick spreadsheet task or a complex multi-source investigation, and internalizing it is what turns scattered technical skills into disciplined work that reliably produces trustworthy insight.
Practical example: an operations manager at a regional logistics company receives weekly shipment logs with 180,000 rows across twelve warehouses. She walks the six-step process: define whether late deliveries cluster by route or carrier, gather the governed export, clean duplicate tracking IDs and null timestamps, group by route and week, interpret a 22% delay spike on two northern routes, and present a staffing recommendation to her director. She documents each step so a colleague can rerun the workflow next month — exactly the demonstrated-outcome evidence that Harvard Business Review's skills-based hiring research describes as increasingly decisive in hiring and promotion decisions.
Methods and Techniques
Within the process, analysts draw on a range of methods and techniques. Statistical methods summarize and test data, from simple averages to regression and hypothesis testing. Exploratory techniques, covered in exploratory data analysis, surface patterns before formal modeling. Segmentation, cohort analysis, and trend analysis are common practical techniques for business questions.
The choice of method depends on the question and the data, and we map the landscape in data analysis methods and data analysis techniques. A key principle is to match the method to the question rather than reaching for the most sophisticated technique available. Often a simple descriptive summary answers the question better than an elaborate model, and the skill lies as much in choosing the right method as in executing it correctly. Dashboard-centric workflows sit within the broader Wikipedia business intelligence overview.
The Tools Landscape
The tools of the discipline span five categories: spreadsheets for ad-hoc work, BI platforms for dashboards, notebooks for statistics and code, statistical packages for documented procedures, and AI-native agents for autonomous, multi-source analysis. Each suits different needs, and we map the full landscape in our companion data analysis tools guide.
| Tool category | Representative options | Best for | Official link |
|---|---|---|---|
| Spreadsheets | Microsoft Excel, Google Sheets | Quick ad-hoc questions on modest tables | microsoft.com / workspace.google.com |
| BI platforms | Tableau, Power BI | Recurring dashboards and self-serve reporting | tableau.com / microsoft.com |
| Notebooks | Jupyter, pandas | Reproducible code-based analysis | jupyter.org / pandas.pydata.org |
| Statistical packages | R, SPSS | Documented statistical procedures | r-project.org / ibm.com |
| AI-native agents | Governed multi-source agents | Plain-language goals with audit trails | IBM augmented analytics |
The right tool depends on your data scale, who does the work, and whether it repeats. A spreadsheet suits a quick one-off question on small data, while recurring analysis across many sources favors an AI-native agent. Rather than seeking a single best tool, most practitioners use two or three, matching each to the task.
The Shift to AI-Native Workflows
The defining change in 2026 is the shift toward AI-native analytical workflows. Where analysis once required a human to drive every step, AI-native agents now take a goal in plain language, plan the steps, run the queries, self-correct on failure, and return a result with an inspectable audit trail. This automates the mechanical work and shifts the human role toward judgment and communication.
For warehouse-scale or multi-source work, supplement fundamentals with governed AI-assisted analysis. We explain the paradigm in what AI-native data analysis means, and the Stanford HAI AI Index tracks how quickly agent-assisted analysis matured. The Bureau of Labor Statistics data analyst profile still lists interpretation and communication as core tasks — roles that grow more valuable as agents absorb routine querying.
How to Get Started
For a newcomer, the way in is to practice the process on a real question rather than to study it abstractly. Pick a dataset you find genuinely interesting, whether public open data or a spreadsheet from your own work, and pose one clear question it might answer. Then walk deliberately through the six steps: define, gather, clean, analyze, interpret, and communicate. Producing one complete, honest answer teaches more than weeks of passive reading, because it forces you to confront the messy reality that theory glosses over.
As you practice, resist two common temptations. The first is to skip cleaning and jump straight to charts, which reliably produces confident but wrong conclusions. The second is to reach for the most sophisticated method available when a simple summary would answer the question better. Discipline, not complexity, is what distinguishes reliable analysis from impressive-looking noise. Start small, finish what you start, and let each completed question raise the difficulty of the next.
Common Failure Modes
Failure 1: Skipping the question. Beginning analysis without a clear question produces answers nobody can use.
Failure 2: Analyzing dirty data. Skipping the cleaning stage yields confident-looking but wrong results.
Failure 3: Over-engineering the method. Reaching for a complex model when a simple summary would answer the question wastes effort.
Failure 4: Neglecting communication. Analysis that is never clearly explained changes no decision.
Failure 5: Treating the result as final. Good analysis raises new questions as often as it settles old ones. The analysts who revisit their conclusions as fresh data arrives stay closer to the truth than those who file a report and move on.
Cluster Guides in This Pillar
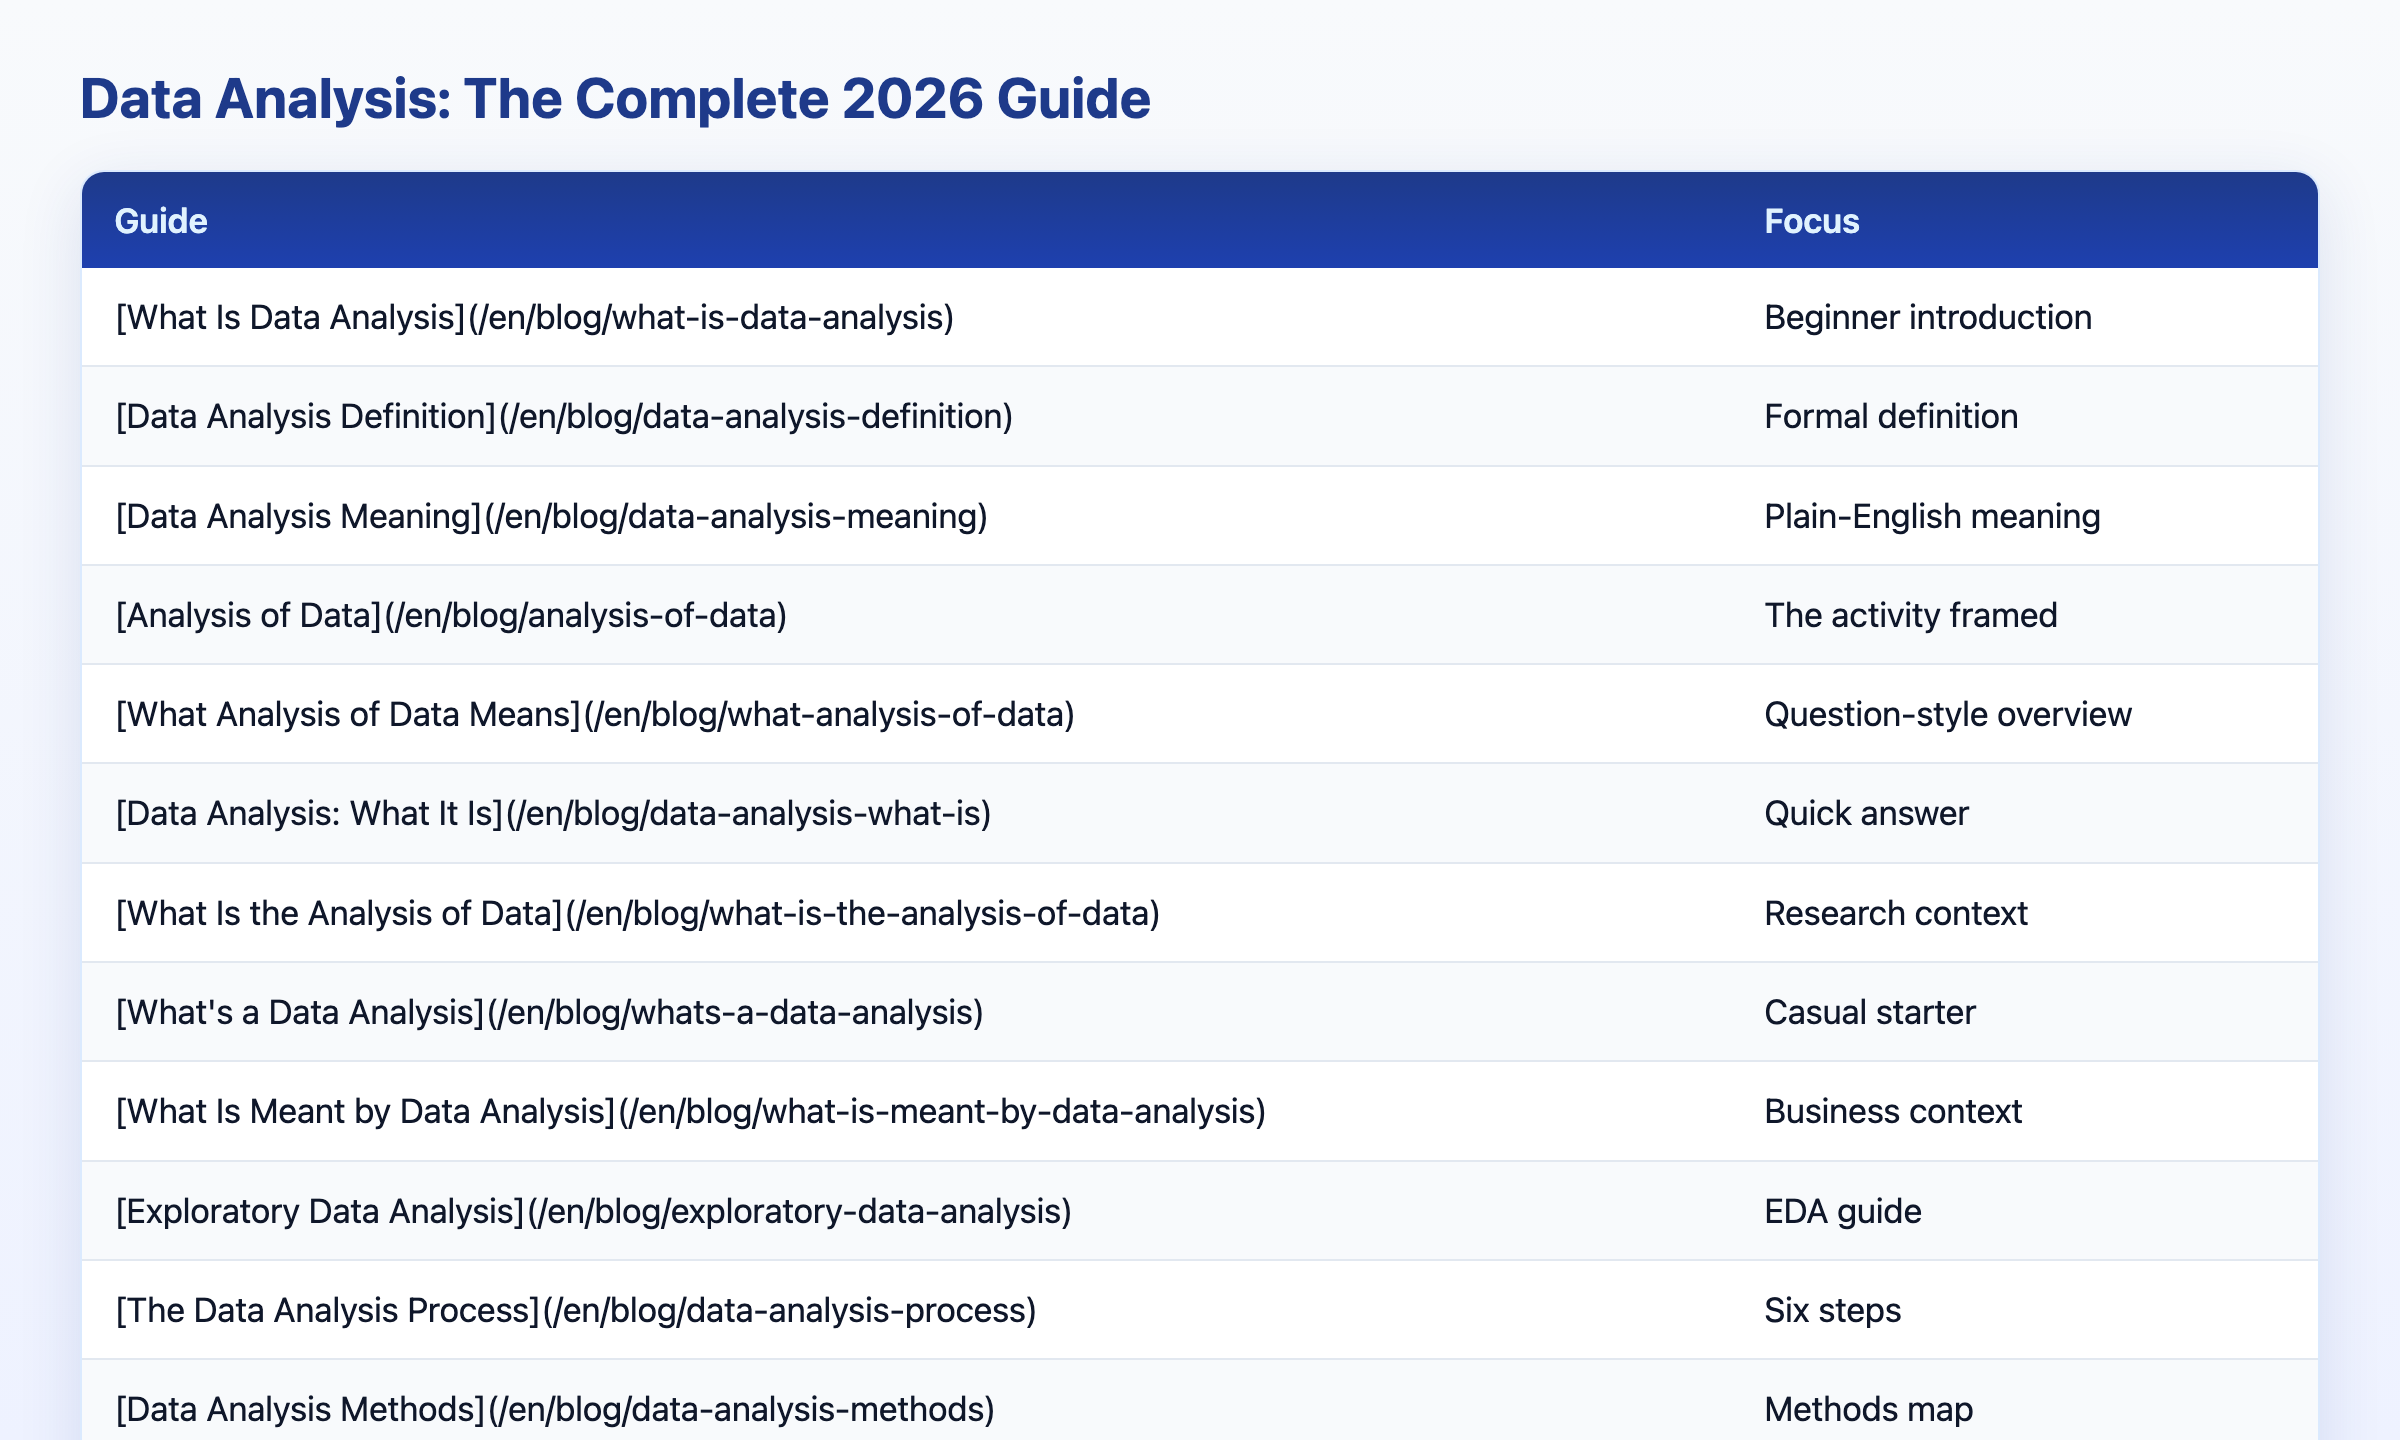
This hub is the map; the guides below go deep on each fundamental concept.
| Guide | Focus |
|---|---|
| What Is Data Analysis | Beginner introduction |
| Data Analysis Definition | Formal definition |
| Data Analysis Meaning | Plain-English meaning |
| Analysis of Data | The activity framed |
| What Analysis of Data Means | Question-style overview |
| Data Analysis: What It Is | Quick answer |
| What Is the Analysis of Data | Research context |
| What's a Data Analysis | Casual starter |
| What Is Meant by Data Analysis | Business context |
| Exploratory Data Analysis | EDA guide |
| The Data Analysis Process | Six steps |
| Data Analysis Methods | Methods map |
| Data Analysis Techniques | Techniques catalog |
| Types of Data Analysis | The four types |
| A Data Analysis Example | One worked example |
| Data Analysis Examples | Examples by industry |
Fundamentals Readiness Scorecard
Evaluate your grasp of analytical fundamentals (1 point each):
| Check | Pass? |
|---|---|
| I can state what analysis is in one sentence | |
| I can name the four types and when each applies | |
| I can walk through the six-step process | |
| I understand why cleaning matters | |
| I can match a method to a question type | |
| I know at least two tool categories and when to use them | |
| I can explain findings to a non-technical stakeholder | |
| I understand how AI-native agents change the workflow |
6–8: solid fundamentals — ready for method-specific guides (top ~25% of learners we advise). 3–5: review this hub and practice one real question (~50% of newcomers). Below 3: start with what is data analysis before advancing.
Frequently Asked Questions
What is it in simple terms?
Data analysis is the process of examining raw data to find useful information that supports decisions. It involves gathering data, cleaning it, exploring and analyzing it with appropriate methods, and communicating what the patterns mean. In simple terms, it turns an overwhelming volume of numbers into a few actionable insights.
What are the main types?
The four types are descriptive (what happened), diagnostic (why it happened), predictive (what will happen), and prescriptive (what we should do). They build on one another in sophistication, with most everyday work being descriptive and diagnostic, while predictive and prescriptive analysis require more advanced methods.
What is the analytical process?
The process has six steps: define the question, gather the relevant data, clean it into a trustworthy form, explore and analyze it with appropriate methods, interpret the results, and communicate the findings clearly. This repeatable process applies whether the analysis is a quick spreadsheet task or a complex multi-source investigation.
What tools are used?
Tools fall into five categories: spreadsheets like Excel, BI platforms like Tableau, notebooks using Python or R, statistical packages like SPSS, and AI-native agents that run autonomous multi-source analysis. Most practitioners use two or three, matching each tool to the task's data scale and recurrence.
How is the discipline changing in 2026?
AI-native tools are automating the mechanical parts of the work, such as cleaning and routine querying, by taking a goal in plain language and planning and running the steps autonomously. This shifts the human role toward framing questions, validating results, and communicating insight, and it makes analysis both more accessible and more powerful.
Conclusion
Data analysis is the disciplined process of turning raw data into decisions, divided into four types, following a repeatable six-step process, and executed with a range of methods and tools. In 2026, AI-native agents automate the mechanical steps while raising the value of the fundamentals this guide covers.
To see how modern tools are transforming the discipline, read what AI-native data analysis means and try the InfiniSynapse web app free on registration, no credit card required.