7 Data Analysis Examples by Industry (2026)
By the InfiniSynapse Data Team · Last updated: 2026-07-09 · We build an AI-native data analysis platform and support analyses across industries; these examples reflect real questions organizations actually ask and answer.
Table of Contents
- TL;DR
- How We Evaluated These Industry Examples
- Why Examples Across Industries Help
- E-commerce: Cart Abandonment
- SaaS: Churn Drivers
- Healthcare: Readmission Rates
- Finance: Fraud Patterns
- Marketing and Operations
- Examples Compared Across Industries
- The Common Thread
- How AI Runs These Examples
- More Questions Worth Exploring
- Learning From Examples Effectively
- Examples Scorecard
- Frequently Asked Questions
- Conclusion
TL;DR
Direct answer: these data analysis examples span seven industries, showing how the same core process, question, data, analysis, insight, applies everywhere. From e-commerce cart abandonment to healthcare readmissions to financial fraud, each example turns a real question into an actionable insight, illustrating that the method transfers even when the domain changes.
Who this is for: anyone wanting concrete data analysis examples across different industries.
What you'll learn: how we evaluated these examples, seven industry cases, comparison tables, the common thread uniting them, and how AI runs them.
This guide sits within the data analysis fundamentals hub; for one example worked in full detail, see a data analysis example. For related depth in this pillar, see The 4 Types of Data Analysis (2026 Guide).
How We Evaluated These Industry Examples
We selected these data analysis examples using criteria that mirror what makes cross-industry cases genuinely instructive, not generic vignettes. Each example was checked against four dimensions: whether the question is characteristic of that industry, whether the analytical process is visible step by step, whether the insight leads to a realistic action, and whether the required rigor matches the domain's stakes.
We cross-referenced the underlying process with the Wikipedia overview of data analysis, which frames analysis as inspecting, cleaning, transforming, and modeling data to surface useful information. We aligned domain expectations with IBM's augmented analytics overview, which tracks how AI-assisted workflows reshape analysis across sectors. The Stanford HAI AI Index documents how quickly agent-assisted analysis moved from research into daily practice. For occupational context we referenced the Bureau of Labor Statistics profile for data analysts and hiring-trend data from LinkedIn's 2025 Future of Recruiting report, which notes that demonstrated analytical output increasingly influences hiring alongside formal credentials.
The table below summarizes the evaluation dimensions we apply when curating data analysis examples for learning and portfolio-building.
| Evaluation dimension | Why it matters in 2026 | What we tested |
|---|---|---|
| Industry authenticity | Generic examples teach little | Each question is characteristic of its domain |
| Process visibility | Structure transfers across fields | Question → data → clean → analyze → insight visible |
| Actionable insight | Analysis without a decision creates little value | Each example ends in a realistic intervention |
| Domain rigor | Stakes differ by industry | Healthcare and finance emphasize validation; e-commerce emphasizes speed |
| Technique proportionality | Over-engineering obscures the method | Simple techniques where they suffice; advanced where required |
| Data realism | Clean fiction misleads | Messy multi-source data acknowledged where relevant |
| Portability | The skill should transfer | Same six-step process across all seven examples |
| Agent compatibility | AI can run similar examples from plain language | Compare hand-worked vs agent-assisted execution |
Why Examples Across Industries Help
Studying data analysis examples from many industries reveals something the abstract process cannot: that the same method applies everywhere, only the questions and data change. Seeing analysis solve an e-commerce problem, then a healthcare problem, then a finance problem, makes clear that the underlying skill is portable, which is reassuring for anyone learning the field or considering which industry to enter.
These data analysis examples also build intuition for how to frame questions in different contexts. Each industry asks characteristic questions, and seeing them answered helps you recognize the patterns of good analytical questions generally. Across all the data analysis examples that follow, the same disciplined process, consistent with the Wikipedia overview of data analysis, plays out, which is precisely the point: mastering the method equips you to tackle questions in any domain you encounter.
E-commerce: Cart Abandonment
The first of our data analysis examples comes from e-commerce, where a store wants to reduce cart abandonment. The question is which stage of checkout loses the most customers and why. The analyst gathers checkout funnel data, cleans it, and analyzes the drop-off at each step, discovering that abandonment spikes at the shipping-cost reveal.
This example, like the best data analysis examples, leads to action: the store tests showing shipping costs earlier or offering free shipping thresholds, then measures the effect. The analysis pinpointed a specific, fixable friction point rather than a vague sense that "checkout needs work." Among data analysis examples, e-commerce funnel analysis is especially common because the behavioral data is rich and the connection between insight and revenue is direct and measurable.
SaaS: Churn Drivers
The second of our data analysis examples is from SaaS, where a company wants to understand why customers churn. The question is which behaviors or attributes distinguish customers who cancel from those who stay. The analyst gathers usage and account data, cleans it, and compares churned versus retained customers, finding that low feature adoption in the first month strongly predicts later churn.
This is among the more valuable data analysis examples because it points to a clear intervention: improve first-month onboarding and feature adoption to reduce churn. The analysis turned an anxious question into a specific, actionable focus. SaaS churn analysis recurs across data analysis examples because retention drives the business model, and behavioral data makes the drivers of churn discoverable through careful comparison and segmentation of the customer base.
Healthcare: Readmission Rates
The third of our data analysis examples comes from healthcare, where a hospital wants to reduce patient readmissions. The question is which patient groups and factors are associated with higher readmission rates. The analyst gathers admission and outcome data, cleans it with particular care given the stakes, and analyzes readmissions across patient segments, identifying factors associated with elevated risk.
Healthcare data analysis examples carry higher stakes and stricter requirements than most, since conclusions can affect patient care and must meet regulatory and accuracy standards. This example illustrates how the same analytical process applies in a high-stakes, regulated context, with extra emphasis on data quality, validation, and careful interpretation. Among data analysis examples, healthcare shows how domain requirements shape the rigor of the analysis without changing its fundamental structure.
Finance: Fraud Patterns
The fourth of our data analysis examples is from finance, where an institution wants to detect fraudulent transactions. The question is what patterns distinguish fraudulent transactions from legitimate ones. The analyst gathers transaction data, cleans it, and analyzes the characteristics of known fraud, identifying patterns like unusual amounts, timing, or location combinations that flag suspicious activity.
Financial data analysis examples demand precision and defensibility, since decisions carry direct monetary and regulatory consequences. This example often extends into predictive analysis, building on the diagnostic patterns to forecast which new transactions are likely fraudulent. Among data analysis examples, fraud detection illustrates how analysis can move up the ladder from describing and diagnosing patterns to predicting future cases, delivering value by catching fraud before it completes.
Marketing and Operations
Our fifth, sixth, and seventh data analysis examples come from marketing and operations. In marketing, an analyst determines which campaigns and channels deliver the best return, gathering spend and conversion data to compare channel performance and reallocate budget toward what works. This is one of the most common data analysis examples in any business.
In operations, two more data analysis examples recur: identifying bottlenecks in a process by analyzing where time is lost, and optimizing inventory by analyzing demand patterns to avoid both stockouts and overstock. Each of these examples follows the same process, a question, relevant data, cleaning, analysis, and an actionable insight, applied to a different operational concern. Together they show how pervasively analysis supports decisions across every function of an organization, not just the obviously data-heavy ones.
Examples Compared Across Industries
The table below compares the seven data analysis examples by industry, question, analytical type, and typical tooling.
| Industry | Question | Analytical type | Typical tooling | Reference |
|---|---|---|---|---|
| E-commerce | Where does checkout lose customers | Diagnostic | Google Analytics, SQL, Mixpanel | Google Analytics documentation |
| SaaS | What predicts churn | Diagnostic + predictive | Product analytics, SQL, pandas | types of data analysis |
| Healthcare | Which factors raise readmission risk | Diagnostic | EHR data, R, validated models | CDC healthcare statistics |
| Finance | What patterns flag fraud | Diagnostic + predictive | Transaction logs, ML pipelines, TensorFlow | FFIEC fraud guidance |
| Marketing | Which channels deliver best ROI | Descriptive + diagnostic | Google Ads, Tableau, SQL | Google Ads documentation |
| Operations | Where do bottlenecks occur | Diagnostic | Process logs, Power BI | Wikipedia process mining |
| Inventory | How to avoid stockouts and overstock | Predictive + prescriptive | Demand forecasting, ERP systems | Forecasting principles (Hyndman) |
Use this table to see how the same process structure repeats while questions, rigor, and tooling shift by domain.
Practical example: a junior analyst studying these data analysis examples recreates the e-commerce funnel analysis on a public dataset, then adapts the same process to a SaaS churn question using a different data source. She publishes both in a portfolio with inspectable SQL and charts—exactly the demonstrated-outcome evidence that Harvard Business Review's skills-based hiring research describes as increasingly decisive in hiring and promotion decisions.
The Common Thread
The unifying lesson across all these examples is that the process is constant while the content varies. Every example began with a specific question, gathered relevant data, cleaned it, analyzed it with appropriate techniques, and ended in an actionable insight. The e-commerce, SaaS, healthcare, finance, marketing, and operations examples differ in their questions and data but share this identical structure.
This common thread across data analysis examples is liberating for anyone learning analysis: master the process once, and you can apply it in any industry by learning that domain's characteristic questions and data. The portability of the method is why analysts move between industries and why the skill is so broadly valuable. Seeing the same structure beneath such varied data analysis examples confirms that analysis is a general capability, not a collection of industry-specific tricks, which is the most important takeaway from studying examples across domains.
How AI Runs These Examples
In 2026, AI-native agents can run each of these examples from a plain-language question, connecting the relevant sources, cleaning the data, and performing the analysis while presenting an inspectable trail. Whether the question concerns cart abandonment, churn, readmissions, or fraud patterns, the agent applies the same process the examples describe, dramatically accelerating the mechanical work.
The human frames the question and judges the insight, especially in high-stakes domains like healthcare and finance. IBM's augmented analytics overview describes this as augmented rather than replaced human judgment. The Stanford HAI AI Index documents how these agents handle exactly the kind of cross-industry analysis these examples represent.
More Questions Worth Exploring
Beyond the seven cases above, countless other questions follow the same pattern, and recognizing them builds your instinct for where analysis adds value. In human resources, an analyst might examine which factors predict employee retention or where a hiring funnel loses strong candidates. In education, which teaching interventions correlate with better outcomes. In logistics, where delays concentrate along a delivery network. Each is a fresh question answered by the same familiar arc.
The point of surveying so many domains is to train your eye to spot analyzable questions in your own context. Wherever a decision is made and relevant data exists, there is likely an analysis worth doing. The most valuable analysts are often those who notice these opportunities, framing a sharp question where others see only a vague concern or an unexamined assumption. Building this habit of recognizing analyzable questions, across whatever domain you work in, turns the study of examples into a practical skill for generating your own high-value analyses rather than merely appreciating others.
Learning From Examples Effectively
To learn effectively from examples, study not just what was found but how the analysis was structured, since the structure is what transfers. For each case, trace the arc: what was the question, what data answered it, how was it cleaned, which technique located the insight, and how was the finding turned into action. Extracting this structure from each case builds a reusable mental template rather than a collection of isolated stories.
It also helps to ask, for each case, what could have gone wrong and how the analyst guarded against it. Where might dirty data have misled the conclusion, where might correlation have been mistaken for causation, and how was uncertainty handled? Studying examples with this critical eye develops the judgment that distinguishes strong analysis from superficial number-crunching. Approached this way, examples become a training ground for analytical thinking, and the more varied the cases you study, the more robust and transferable the instincts you build for tackling new questions in any domain you encounter.
Examples Scorecard
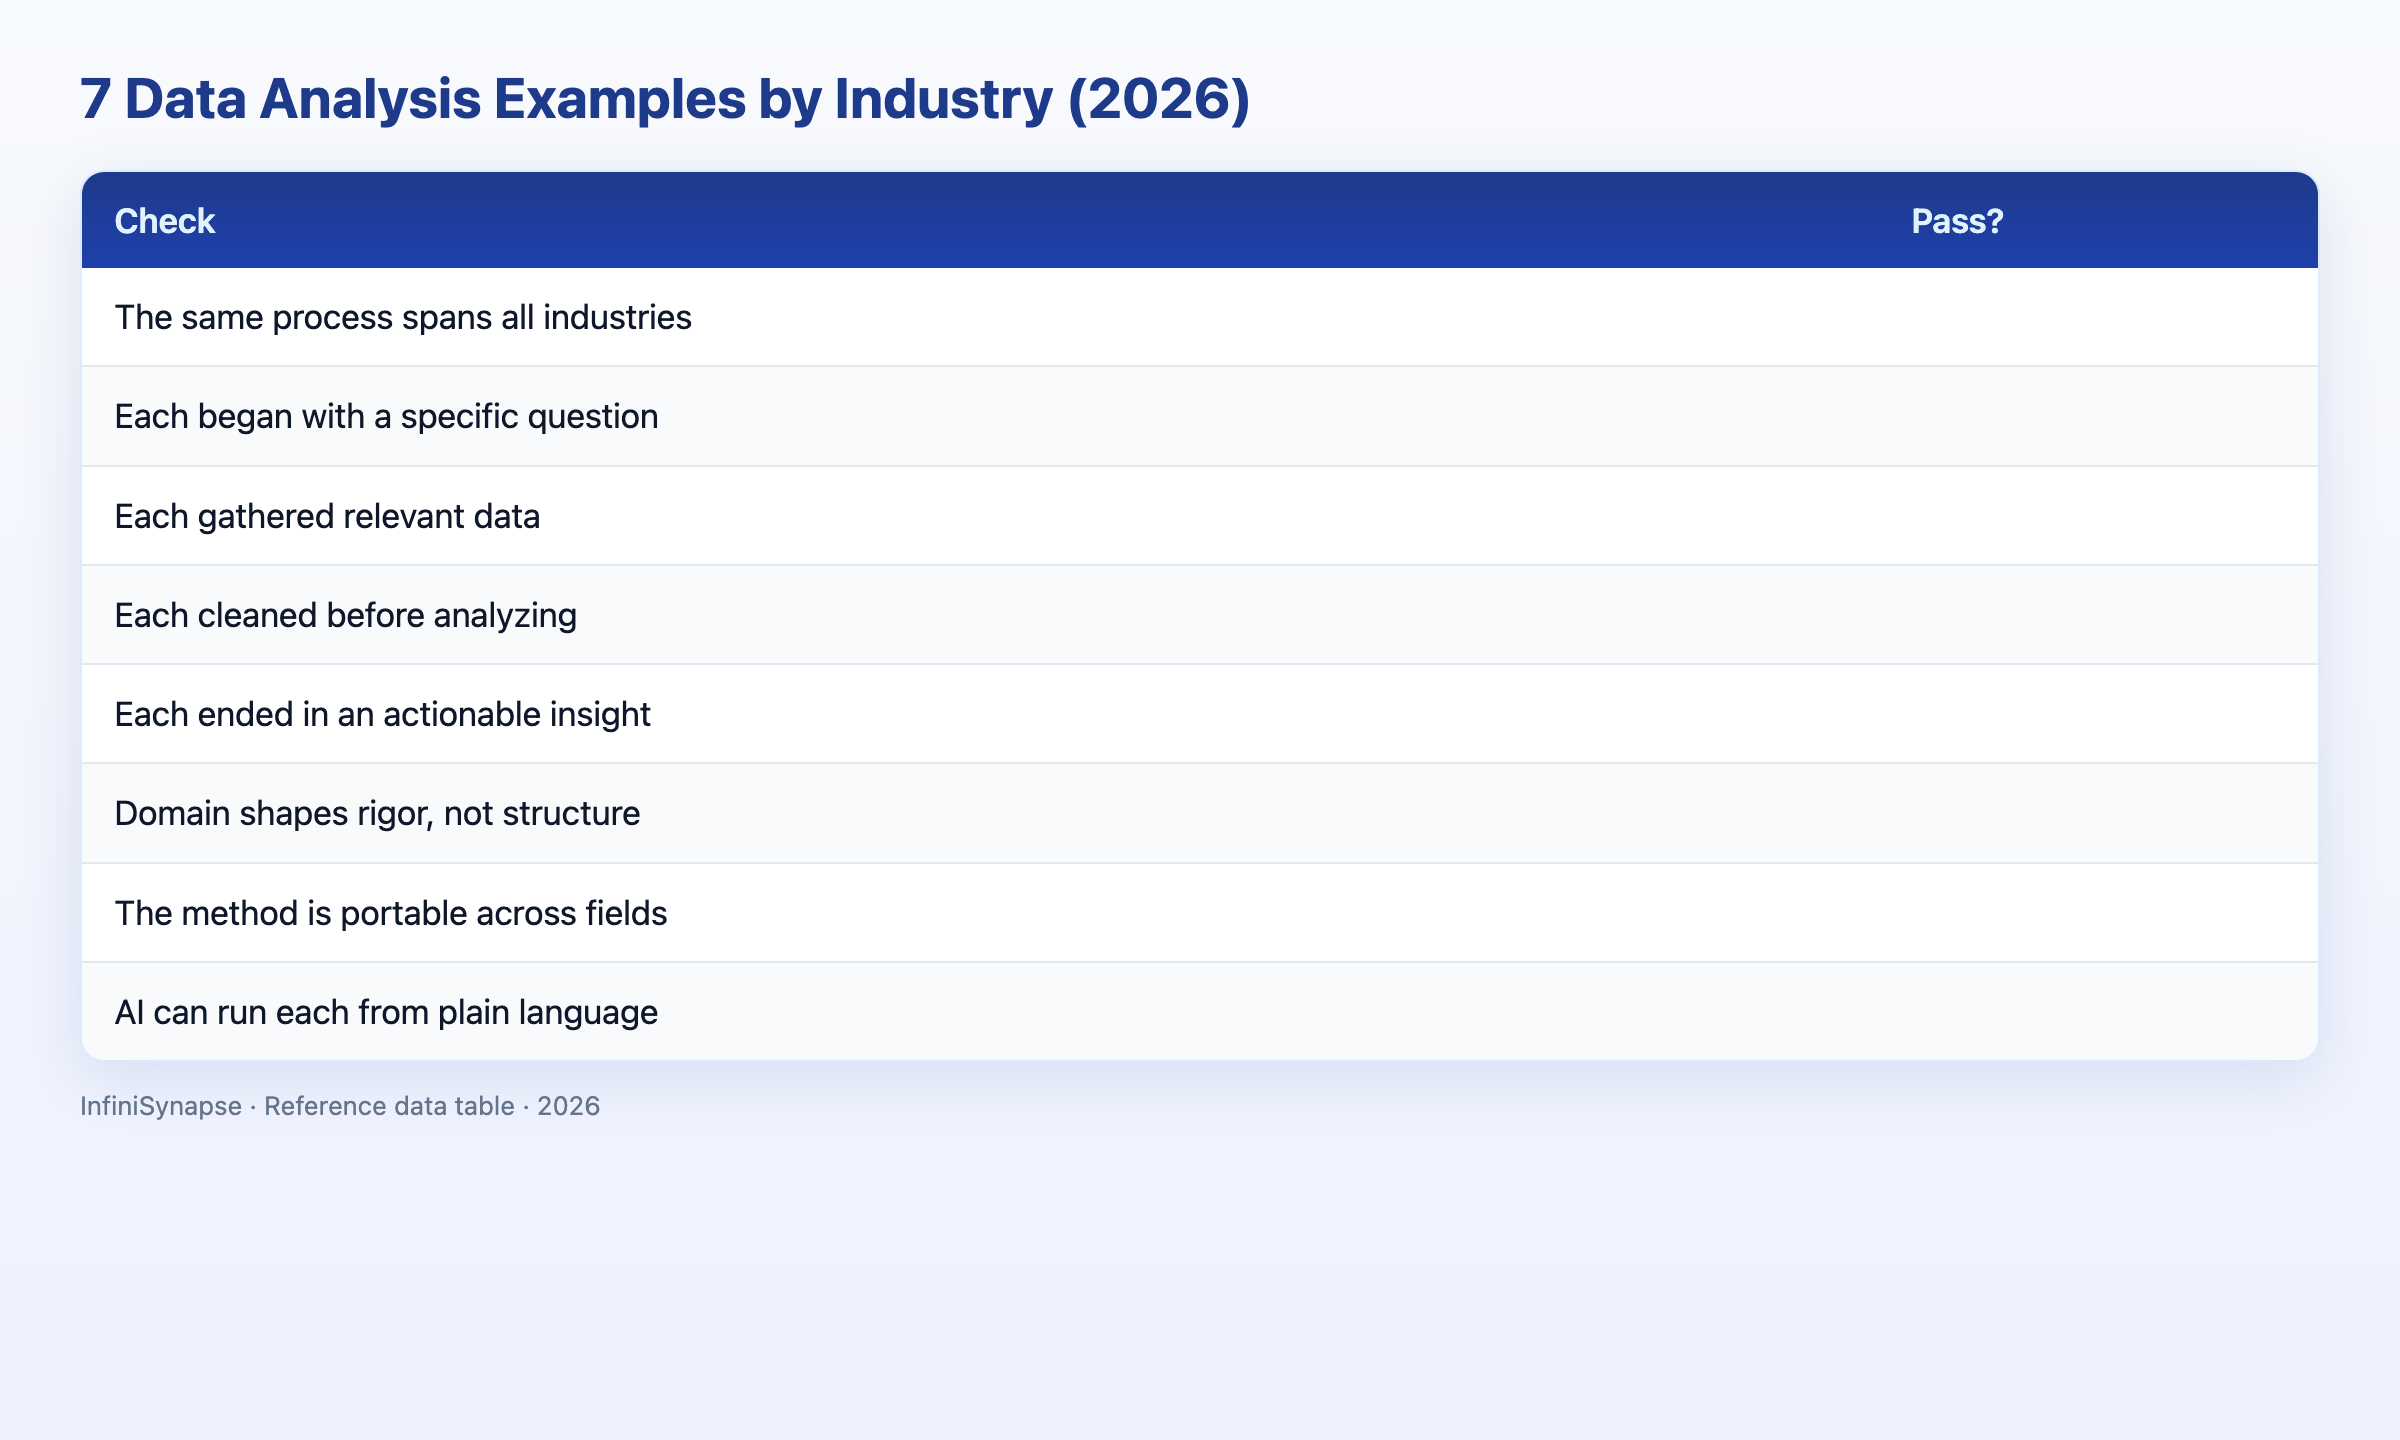
Check what these examples demonstrate (1 point each):
| Check | Pass? |
|---|---|
| The same process spans all industries | |
| Each began with a specific question | |
| Each gathered relevant data | |
| Each cleaned before analyzing | |
| Each ended in an actionable insight | |
| Domain shapes rigor, not structure | |
| The method is portable across fields | |
| AI can run each from plain language |
6–8: you see the common thread. 3–5: revisit an example. Below 3: reread the process.
Frequently Asked Questions
What are some real cases by industry?
Real data analysis examples include e-commerce cart-abandonment analysis, SaaS churn-driver analysis, healthcare readmission analysis, financial fraud-pattern detection, marketing channel-performance analysis, operational bottleneck analysis, and inventory optimization. Each takes a specific industry question through the same process, gather, clean, analyze, insight, to an actionable result.
Do cases differ by industry?
Data analysis examples differ by industry in their questions, data, and required rigor, but not in their fundamental structure. E-commerce asks about funnels, healthcare about outcomes, finance about fraud, yet each follows the same process. High-stakes domains like healthcare and finance add emphasis on validation and defensibility without changing the underlying method.
What do all cases have in common?
All data analysis examples share the same process: a specific question, relevant data, cleaning, analysis with appropriate techniques, and an actionable insight. The content varies by industry, but this structure is constant, which means mastering the process once lets you apply it in any domain by learning that field's characteristic questions and data.
Which case is best for beginners?
For beginners, simpler data analysis examples like e-commerce cart abandonment or marketing channel performance are ideal, since the questions are intuitive and the analysis uses straightforward comparison and segmentation. Starting with these before tackling higher-stakes examples like healthcare or predictive fraud detection builds confidence with the process on approachable questions.
How does AI handle cross-industry cases?
AI-native tools handle these examples by running each from a plain-language question, connecting sources, cleaning data, and performing the analysis with an inspectable trail. Whether the question concerns churn, fraud, or readmissions, the agent applies the same process while the human frames the question and judges the insight, especially in high-stakes domains.
Conclusion
These seven data analysis examples across e-commerce, SaaS, healthcare, finance, marketing, and operations show that the analytical process is constant while the questions and data vary by industry. The common thread, question to insight through a disciplined process, means the method is portable, and in 2026 AI-native agents can run each from a plain-language question.
To see one example in full detail and the tools behind them, read a data analysis example and what AI-native data analysis means, then try the InfiniSynapse web app free on registration, no credit card required.