What Is a Data Analysis Platform? A 2026 Guide
By the InfiniSynapse Data Team · Last updated: 2026-07-09 · We build an AI-native data analysis platform and evaluate competing systems on real workloads; this guide reflects hands-on architecture experience, not marketing copy.
Table of Contents
- TL;DR
- How We Evaluated Platform Candidates
- Platform vs Point Tool
- The Four Layers an Integrated System Spans
- When You Need a Platform, Not a Tool
- Types of Integrated Analytics Systems
- Major Platforms Compared
- How Platforms Handle Data Preparation
- Governance and Access in an Integrated System
- Migration: The Hidden Cost of Adoption
- The AI-Native Model
- Platform Selection Scorecard
- From Point Tools to a Platform: A Migration Path
- Common Failure Modes
- Frequently Asked Questions
- Conclusion
TL;DR
Direct answer: a data analysis platform is integrated software that spans the whole workflow—connecting to sources, preparing data, running analysis, and sharing results—rather than solving a single step. You need one when analysis becomes a team activity across many sources, not a solo task in one file.
Who this is for: teams deciding whether a point tool is enough or whether they need a full data analysis platform.
What you'll learn: how we evaluated candidates, how a platform differs from a tool, the layers it covers, when the upgrade is justified, platform types, and how the AI-native model reshapes the category.
This zooms in on the platform concept within our data analysis tools hub. To compare specific options, read top data analysis platforms compared. For related depth in this pillar, see Best Data Analysis Software in 2026: Free and Paid.
How We Evaluated Platform Candidates
We selected every system in this guide using criteria that predict whether a platform survives a year in production, not whether it wins a demo. Each candidate was checked against connection breadth (does it read existing sources without migration?), preparation power (does it clean messy data or only present modeled data?), analysis depth at scale, sharing with governance, and whether recurring work gets faster on the second run. We cross-referenced these workflow stages with the Wikipedia data analysis overview, which describes analysis as a continuous process from acquisition through communication.
Integration and governance matter too. A data analysis platform that dazzles on sample data but stumbles on your actual exports will disappoint in week two. We favor products with transparent documentation from the vendor, trial paths on real data, and pricing models you can model for twelve months. The convergence of BI, warehouse analytics, and AI-assisted workflows is tracked in IBM's augmented analytics overview, which frames how modern platforms are absorbing automation that used to require separate tools.
We validated claims against official vendor documentation: Tableau's product documentation for dashboard governance, Microsoft Learn for Power BI for enterprise sharing, Looker documentation for modeled metrics, and Databricks documentation for warehouse lineage and access control. Adoption velocity for agent-assisted analysis appears in the Stanford HAI AI Index, which we use as a benchmark for how quickly autonomy moved from research into production roles.
Platform vs Point Tool
A point tool solves one step well—a spreadsheet for math, a chart library for visuals. A data analysis platform integrates several steps so data flows from source to insight without manual handoffs between disconnected apps.
Key Definition: a data analysis platform is an integrated system that connects to data sources, prepares and transforms data, performs analysis, and shares results within one governed environment, as opposed to a single-purpose tool that handles only one stage.
The distinction matters because the friction in real work often lives between tools—exporting from one app, cleaning in another, charting in a third. A data analysis platform exists precisely to keep that process continuous instead of stitched together by hand.
The Four Layers an Integrated System Spans
A complete integrated system typically covers four layers:
- Connection — read from databases, warehouses, and files without a migration project.
- Preparation — clean, join, and transform data into an analyzable shape.
- Analysis — query, compute metrics, model, and detect patterns.
- Sharing and governance — distribute results with access control and an audit trail.
A point tool covers one layer. The value of a platform is that the layers connect, so a change in the source propagates through preparation and analysis without re-exporting files. IBM's augmented analytics overview frames this integration as the defining feature of modern analytics platforms.
When You Need a Platform, Not a Tool
You have outgrown point tools and need a data analysis platform when:
- Multiple people must work from the same governed numbers.
- Data lives across several sources that must be joined.
- The same analysis repeats on a schedule.
- "Who has the latest version?" has become a recurring question.
If none of these apply, a point tool is cheaper and simpler. If most apply, the integration a platform provides pays for itself by eliminating the manual handoffs that cause errors and delay. Scripted analysis should follow Python documentation conventions for reproducibility when code is part of the stack.
Types of Integrated Analytics Systems
- BI platforms (Tableau, Power BI, Looker): strong on the analysis-and-sharing layers, lighter on preparation.
- Data science platforms (notebook services): strong on analysis and modeling, require code.
- Warehouse-centric platforms: strong on scale, governed by tools documented in Databricks' documentation.
- AI-native platforms: span all four layers and add autonomy and memory.
Each type of data analysis platform emphasizes different layers, so the right one depends on which layer is your bottleneck. Buyers comparing a data analysis platform against point tools should weight preparation and governance as heavily as visualization polish.
Major Platforms Compared
The table below summarizes the integrated systems employers most often evaluate in 2026. For a head-to-head family comparison, see data analysis platforms compared.
| Platform | Provider | Strongest layer | Connection model | Best for |
|---|---|---|---|---|
| Tableau Server / Cloud | Salesforce | Sharing and visualization | Connects to warehouses and files | Teams distributing governed dashboards to many viewers |
| Power BI Service | Microsoft | Sharing within Microsoft 365 | Native Azure and on-prem connectors | Organizations standardized on Microsoft stacks |
| Looker | Google Cloud | Governed metric definitions | Modeled semantic layer on warehouses | Teams needing a single source of truth for KPIs |
| Databricks SQL | Databricks | Scale and warehouse governance | In-warehouse queries | Engineering teams with large cloud warehouses |
| Snowflake | Snowflake Inc. | Scale and secure sharing | Cloud-native warehouse | Organizations centralizing data in Snowflake |
No single data analysis platform dominates every layer. BI platforms excel at sharing but often assume upstream preparation; warehouse-centric systems excel at scale but need an analysis surface on top. What matters is whether the platform removes your bottleneck rather than adding another silo.
Practical example: a twelve-person operations team used spreadsheets and emailed CSV exports until "who has the latest version?" became a weekly argument. They staged adoption by connecting Looker to their Snowflake warehouse, reproducing one trusted weekly report, and running it for a month. The second and third runs dropped from four analyst-hours to twenty minutes because the metric definitions were governed in one place—a pattern consistent with Harvard Business Review's skills-based hiring research, which notes that teams increasingly justify platform spend by recovered analyst time and reduced coordination friction.
How Platforms Handle Data Preparation
Preparation is the layer where integrated systems separate most sharply from point tools. A spreadsheet or a chart library assumes the data arriving is already clean; in reality, raw sources carry missing values, inconsistent formats, duplicate keys, and columns that mean different things in different systems. An integrated system addresses this by profiling sources on arrival, flagging anomalies, and standardizing definitions before analysis begins.
The practical payoff is trust. When preparation is a first-class stage rather than an afterthought handled in a separate app, the numbers that reach a dashboard are defensible. Teams that skip this stage—presenting raw or lightly cleaned data—eventually ship a wrong figure into a decision, and the cost of that single error often exceeds a year of subscription fees. This is why buyers should weigh preparation power as heavily as visualization polish, even though demos rarely dwell on it.
Governance and Access in an Integrated System
Once analysis becomes a team activity, governance stops being optional. Who can see which data, who can change a metric definition, and who approved a number before it reached leadership all become questions with real consequences. An integrated system answers them with project-level access control, audit trails at the query level, and an approval step before a definition becomes canonical.
Point tools rarely provide this, because a single spreadsheet on one laptop has no concept of shared truth. As soon as two people work from the same numbers, the absence of governance produces the familiar problem of dueling figures in competing decks. A governed data analysis platform solves that coordination problem; a point tool cannot.
Migration: The Hidden Cost of Adoption
The most underestimated cost of adopting an integrated system is migration. Some systems require you to move data into their proprietary store before you can analyze anything. That migration is measured in weeks, adds ongoing sync overhead, and creates a second copy of the truth that can drift from the original.
The alternative is a system that reads existing sources in place with one-click authorization, analyzing data where it already lives. This design eliminates the migration tax entirely and keeps a single source of truth. When evaluating a data analysis platform, ask bluntly whether adoption requires moving data, because the answer often decides whether a rollout takes an afternoon or a quarter.
The AI-Native Model
The newest category is the AI-native data analysis platform, which spans all four layers and adds something older platforms lack: autonomy. Rather than an NLP2SQL box or a ChatBI widget, these systems plan multi-step analysis from a plain-language goal, self-correct on failure, and remember finished tasks. We explain the paradigm in what AI-native data analysis means, and the Stanford HAI AI Index documents how quickly this data analysis platform category became production-grade.
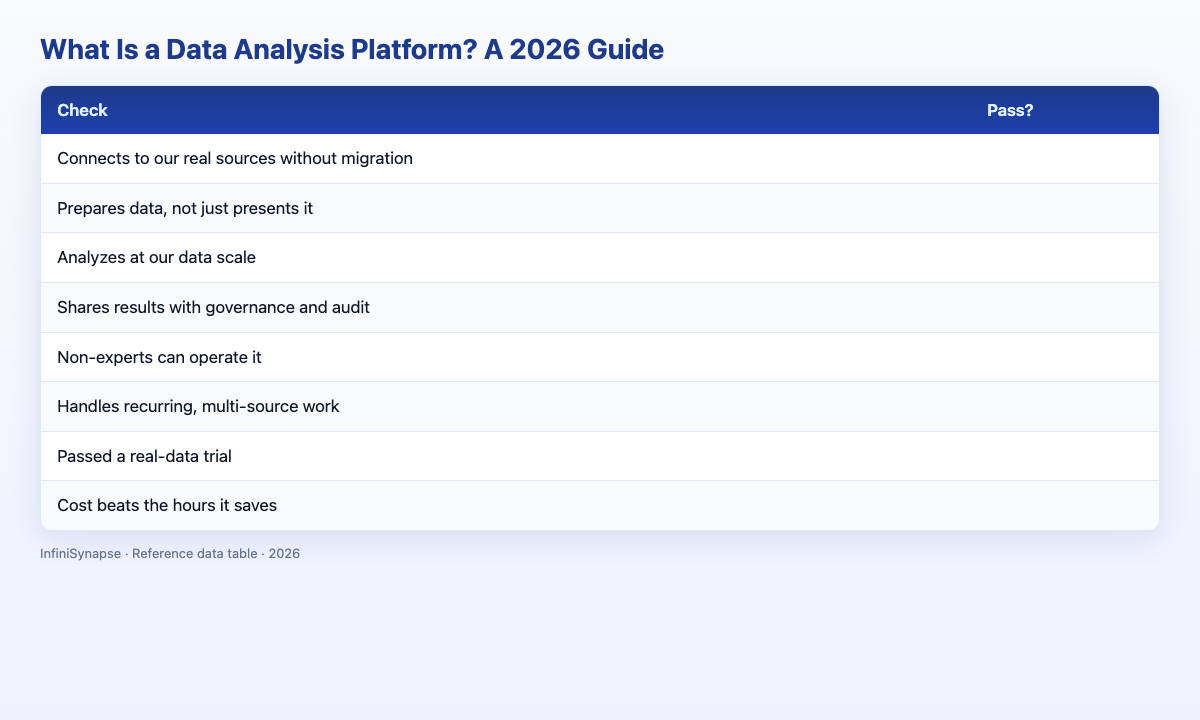
Platform Selection Scorecard
Score any integrated system (1 point each):
| Check | Pass? |
|---|---|
| Connects to our real sources without migration | |
| Prepares data, not just presents it | |
| Analyzes at our data scale | |
| Shares results with governance and audit | |
| Non-experts can operate it | |
| Handles recurring, multi-source work | |
| Passed a real-data trial | |
| Cost beats the hours it saves |
6–8: adopt. 3–5: scope it. Below 3: a point tool may be enough.
From Point Tools to a Platform: A Migration Path
Teams rarely adopt an integrated system overnight. The healthier route is a staged migration that proves value before it demands commitment. Start by connecting the system to a single high-value source and reproducing one analysis your team already trusts. This validates the connection and preparation layers on real data without betting the whole workflow on an unproven choice.
Next, move one recurring report onto the system and run it for a month. Recurring work is where integration pays off, so this stage reveals whether the promised time savings are real. Measure the second and third runs, not just the first, because the value of memory and reuse only appears on repetition. If the report that took an afternoon now takes minutes, the case for broader adoption makes itself.
Finally, expand to additional sources and users once the core workflow is proven. Bring the people who will rely on the system into the trial early, since adoption succeeds or fails on whether non-specialists can operate the data analysis platform you selected. A staged path de-risks the decision: each step is reversible, the evidence accumulates on your own data, and the team grows comfortable before the integrated system becomes load-bearing.
Document each stage of the rollout so future teammates inherit the reasoning behind your data analysis platform choice, not just the login credentials.
Common Failure Modes
Failure 1: Buying a platform for a point problem. If your only need is quick charts, a data analysis platform is overkill.
Failure 2: Ignoring the preparation layer. A platform strong on dashboards but weak on cleaning leaves the hardest work manual.
Failure 3: Migration lock-in. Platforms that force you to move data before analyzing it impose a heavy tax.
Failure 4: No governance. An ungoverned platform eventually ships a wrong number into a decision.
Frequently Asked Questions
What is an integrated analytics platform?
An integrated data analysis platform spans connecting to data sources, preparing and transforming data, running analysis, and sharing results within one governed environment. It differs from a point tool, which handles only a single step such as charting or spreadsheet math.
How does a platform differ from a BI tool?
A BI tool excels at the sharing and visualization layers but often assumes data is already modeled upstream. A full data analysis platform integrates connection, preparation, analysis, and sharing so data flows continuously without manual handoffs between apps.
When do you need an integrated platform?
You need a data analysis platform when multiple people work from shared numbers, data spans several sources, or the same analysis repeats on a schedule. If your work is solo, single-source, and one-off, a point tool is cheaper and simpler.
What are examples of analytics platforms?
Examples include BI platforms like Tableau and Power BI, warehouse-centric systems like Databricks and Snowflake, and AI-native data analysis platform options that span all four workflow layers with autonomy and memory.
What should buyers validate before adopting?
Run a real-data trial that exercises connection, preparation, and sharing on messy sources—not a curated demo. Measure the second run of a recurring report on your data analysis platform shortlist, confirm governance and audit trails meet compliance needs, and verify the system connects without forcing a full data migration.
Conclusion
A data analysis platform earns its place when analysis becomes a team activity spanning many sources and repeating over time. Match the platform type to your bottleneck layer—preparation, analysis, or sharing—and weight integration and governance heavily. Above all, insist on a real trial before committing, because the difference between a point tool and an integrated system only becomes obvious once your own messy data flows through every layer end to end.
If your bottleneck is recurring, multi-source work, an AI-native platform is the most direct answer. See how AI-native data analysis works and try the InfiniSynapse web app free on registration, no credit card required.