How to Choose a Data Analysis Tool in 2026
By the InfiniSynapse Data Team · Last updated: 2026-07-09 · We build an AI-native data analysis platform and run procurement-style evaluations on competing products; this framework comes from real selection decisions, not a feature checklist.
Table of Contents
- TL;DR
- How We Evaluated Data Analysis Tool Selection
- Start With the Bottleneck, Not the Brand
- The Candidate Categories
- A Framework for Choosing a Data Analysis Tool
- Questions to Ask Any Vendor
- When the Right Tool Is an AI-Native Agent
- Evaluation Scorecard
- A Worked Example: Choosing for a Weekly Report
- Build vs Buy: Assembling Your Own Stack
- What Changes as Your Team Grows
- Signs You Chose the Wrong Tool
- Failure Modes in Tool Selection
- Frequently Asked Questions
- Conclusion
TL;DR
Direct answer: to choose a data analysis tool in 2026, name your single biggest bottleneck first—preparation, scale, sharing, or repetition—then pick the category that solves it and test two candidates on your real data. The brand matters less than matching the tool to the pain.
Who this is for: anyone selecting a data analysis tool for themselves or a team and unsure where to start.
What you'll learn: why the bottleneck comes before the brand, the candidate categories, a five-step selection framework, the questions that expose weak vendors, and when the right answer is an AI-native agent.
This guide zooms in on the decision; for the full category map, read the data analysis tools hub, and for a business-buyer roundup, see best data analysis software. For fundamentals, see what data analysis is and how it works.
How We Evaluated Data Analysis Tool Selection
We evaluated data analysis tool selection frameworks by running them against real procurement decisions—not hypothetical feature matrices. Each shortlisted product was tested on source connectivity, performance at production scale, traceability of outputs, and whether finished work survives for reuse. We aligned stage definitions with the Wikipedia overview of data analysis, which describes acquiring, cleaning, transforming, modeling, and communicating data.
We cross-referenced autonomy expectations with IBM's augmented analytics overview and adoption velocity with the Stanford HAI AI Index. For spreadsheet, BI, and code baselines we referenced Microsoft Learn's Excel documentation, Tableau's getting-started guide, and the Python documentation for reproducible notebook workflows.
The table below summarizes the evaluation criteria we apply when helping teams choose a data analysis tool.
| Evaluation criterion | Why it matters | What we measure |
|---|---|---|
| Bottleneck match | Wrong category never fits | Does the tool solve preparation, scale, sharing, or repetition? |
| Source connectivity | Migration kills ROI | Connect Snowflake, Postgres, Excel without moving data |
| Data scale | Demos lie about performance | Same task at 100K vs 10M+ rows |
| Traceability | Wrong numbers destroy trust | Every metric links to an inspectable query |
| Reuse | Recurring work dominates time | Repeat the analysis a month later; count re-setup |
| Accessibility | Specialist-only tools bottleneck teams | Non-experts can operate after minimal training |
| Trial on real data | Sample datasets hide failures | Messy production export, not vendor CSV |
| Total cost | License is only part of the bill | License plus analyst hours saved or consumed |
Start With the Bottleneck, Not the Brand
The most common mistake in choosing a data analysis tool is starting from a brand name someone mentioned in a meeting. That reverses the logic. A tool is only "good" relative to the problem it removes.
Key Definition: a data analysis tool is software that helps you acquire, clean, analyze, and visualize data to answer a question. The right one is defined by your bottleneck, not by its feature list.
Ask a blunt question: what part of analysis hurts most? The answer is almost always one of four bottlenecks—cleaning and preparing data, scaling past what a spreadsheet handles, sharing results with others, or repeating the same analysis on a schedule. The Wikipedia data analysis overview describes the stages; your pain lives in one or two of them, and that is where your data analysis tool should be strongest.
The Candidate Categories
Once you know the bottleneck, the category almost picks itself.
| Bottleneck | Best category | Example tools | Official link |
|---|---|---|---|
| Preparation | AI-native agent or notebook | AI-native agent, Python | python.org |
| Scale | Warehouse-backed platform | Snowflake, BI platforms | snowflake.com |
| Sharing | BI / dashboards | Tableau, Power BI | tableau.com |
| Repetition | AI-native agent | AI-native platforms | See AI-native guide |
| Ad-hoc math | Spreadsheet | Excel, Google Sheets | microsoft.com |
Notice that a single data analysis tool rarely wins every row, which is why most teams run two. For the Excel end of this spectrum, see Excel as a data analysis tool; for the dashboard end, see Tableau as a data analysis tool.
A Framework for Choosing a Data Analysis Tool
Step 1 — Write down the bottleneck in one sentence. If you cannot, you are not ready to compare tools.
Step 2 — Pick the matching category. Use the table above. Resist the urge to compare across categories.
Step 3 — Shortlist two candidates. Two is enough to learn the trade-offs without analysis paralysis.
Step 4 — Run your real task. Load your actual messy file or connect your real database. A data analysis tool that only shines on demo data is a liability.
Step 5 — Measure the recurring case. Run the task twice, a month apart, and count how much context you had to re-supply. This single measurement separates modern tools from legacy ones.
For query-heavy selection, pair this with our guide to natural language to SQL, since automatic query generation is now a realistic requirement rather than a nice-to-have. Use-case picks live in tools for data analysis by use case.
Questions to Ask Any Vendor
These questions expose whether a data analysis tool is production-ready or demo-ware.
- Can you connect to my real sources without a migration project?
- What happens at my actual row count—not the demo dataset?
- Can I trace every number back to the query that produced it?
- What survives after I finish an analysis—does next month start from scratch?
- Who on my team can actually operate this without training?
IBM's augmented analytics overview makes the same point at market scale: transparency and reuse, not raw feature counts, predict whether a tool stays deployed. The Stanford HAI AI Index documents how fast autonomy moved from research into shippable products, which is why the "what survives" question now matters so much.
When the Right Tool Is an AI-Native Agent
If your honest bottleneck is preparation or repetition, the right data analysis tool is probably an AI-native agent rather than a dashboard or a notebook. These agents take a goal in plain language, plan the steps, query across sources, self-correct on failure, and return an inspectable audit trail.
For warehouse-scale or multi-source work, supplement spreadsheets or BI tools with hands-on AI practice. We explain the paradigm in what AI-native data analysis means. Governance-minded buyers should validate lineage the way Databricks documentation recommends. Scripted analysis should follow Python documentation conventions for reproducibility when code remains part of the stack.
Evaluation Scorecard
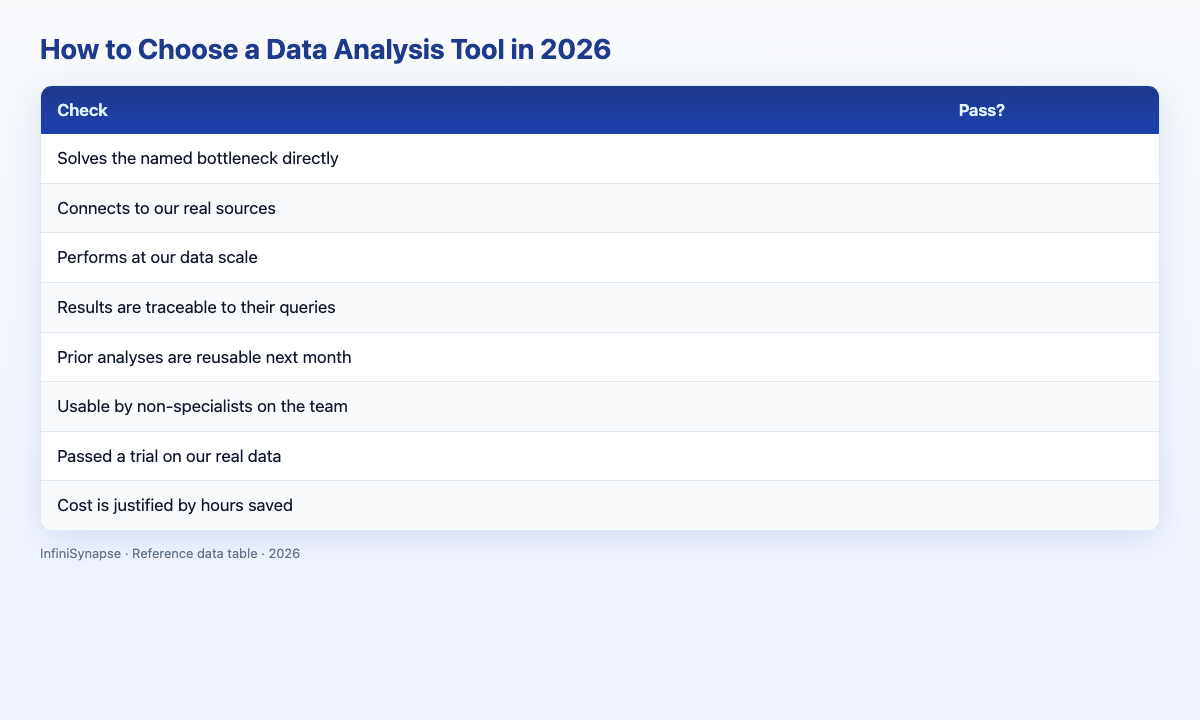
Score each shortlisted data analysis tool (1 point each):
| Check | Pass? |
|---|---|
| Solves the named bottleneck directly | |
| Connects to our real sources | |
| Performs at our data scale | |
| Results are traceable to their queries | |
| Prior analyses are reusable next month | |
| Usable by non-specialists on the team | |
| Passed a trial on our real data | |
| Cost is justified by hours saved |
6–8: strong fit (~25% of candidates). 3–5: scoped use only (~50%). Below 3: eliminate it.
A Worked Example: Choosing for a Weekly Report
Consider a concrete case. An operations lead needs the same churn-and-revenue report every Monday, pulling from a Postgres production database and a spreadsheet of manual adjustments. The bottleneck is repetition, so the category is an AI-native agent, not a dashboard.
Two candidates make the shortlist. The lead connects both to the real Postgres instance and the real adjustment sheet, then asks each for the Monday report. Candidate one produces a clean answer but requires the schema and metric definitions to be re-entered on the second run. Candidate two remembers those definitions and reproduces the report from a single sentence the following week. On correctness they tie; on the recurring case, candidate two wins decisively. The lead picks it not because it demoed better, but because the second run took ninety seconds instead of forty minutes.
Practical example: when the operations lead presents this evidence to the VP of Finance, the decision mirrors what Harvard Business Review's skills-based hiring research describes as increasingly standard: measurable outcomes beat brand names. The VP approves because the recurring case—not the demo—proved the data analysis tool choice.
Build vs Buy: Assembling Your Own Stack
Some teams consider building their own analysis pipeline from open-source parts instead of buying a finished product. This can be the right call when your needs are genuinely unusual, but it is the wrong default for most teams. A hand-assembled stack of scripts, schedulers, and dashboards carries maintenance debt that grows every quarter, and the knowledge often lives in one engineer's head where it becomes a single point of failure.
Buy when your bottleneck is common—preparation, scale, sharing, or repetition—because a finished product has already solved those problems and will maintain the solution for you. Build only when you have a requirement no product on the market meets and the engineering capacity to own it indefinitely. For most teams, the honest answer is to buy the category that fits and spend the saved engineering time on the questions only humans can answer.
What Changes as Your Team Grows
A tool that fits a solo analyst rarely fits a twenty-person team, and the reverse is also true. Early on, flexibility and low cost matter most, so a spreadsheet plus a free AI-native tier is often ideal. As the team grows, governance, shared definitions, and access control move to the front, because inconsistent numbers across people become the expensive problem that undermines confidence in the whole reporting stack.
Plan for one transition in advance: the day when "who has the latest version of this analysis?" becomes a recurring question. That is the signal to graduate from ad-hoc files to something with shared, governed outputs and a memory of prior work. Choosing with that transition in mind saves a painful re-selection a year later.
Signs You Chose the Wrong Tool
A quick diagnostic. You likely chose the wrong option if, after a month, any of these are true: you still export data to a second tool to finish the job; only one person can run the important analyses; every recurring report starts from a blank slate; or you spend more time formatting output than interpreting it. None of these is fatal on its own, but two or more together mean the software is fighting your workflow instead of serving it.
Even a good choice ages. Sources change, the team grows, and new questions appear that the original bottleneck did not include. Put a light re-evaluation on the calendar once a year: confirm the software still connects to current sources, still performs at current scale, and still serves the people who depend on it.
Failure Modes in Tool Selection
Failure 1: Brand-first thinking. Choosing a data analysis tool because a competitor uses it ignores whether it fixes your bottleneck.
Failure 2: Cross-category comparison. Pitting a notebook against a dashboard wastes time; they solve different problems.
Failure 3: Demo-data trials. The sample dataset hides the failures that appear on real, dirty data.
Failure 4: Ignoring reuse. A tool that forgets every session is costly across a year of recurring reports, no matter how cheap the license.
Frequently Asked Questions
How do I choose the right tool?
Choose a data analysis tool by naming your biggest bottleneck first—preparation, scale, sharing, or repetition—then pick the category that solves it and test two candidates on your real data. Matching the tool to the pain matters far more than picking a popular brand.
What is the best tool to start with?
For beginners, the best data analysis tool is usually a spreadsheet (Excel or Google Sheets) for fundamentals plus an AI-native agent so you can ask questions in plain language. That combination produces real analysis without requiring you to write formulas or SQL on day one.
Should I use one tool or several?
Most teams use two or three because no single data analysis tool wins every scenario. A common pattern is a spreadsheet for quick math, a BI platform (Tableau or Power BI) for shared dashboards, and an AI-native agent for recurring, multi-source analysis.
What makes a tool production-ready?
A production-ready data analysis tool connects to your real sources without migration, holds performance at your data scale, traces every result back to its query, and preserves finished analyses for reuse. Tools that only perform on demo data usually fail in month two.
Can a tool handle recurring reports?
Yes, if the category matches the bottleneck. AI-native agents and governed BI platforms handle recurring work best; spreadsheets and one-off notebook scripts do not. Measure the recurring case during your trial—repeat the same report a month later and count how much setup you redo.
Conclusion
Choosing a data analysis tool in 2026 is a bottleneck problem, not a brand problem. Name the pain, match the category, shortlist two, test on real data, and measure the recurring case—then let the evidence decide.
To practice AI-native workflows on your own data, try the InfiniSynapse web app free on registration, no credit card required.