Data Analysis Tools: The Complete 2026 Guide
By the InfiniSynapse Data Team · Last updated: 2026-07-09 · We build an AI-native data analysis platform and test data analysis tools against real customer workloads; this guide reflects hands-on procurement evaluations, not vendor marketing.
Table of Contents
- TL;DR
- How We Evaluated Data Analysis Tools
- What These Tools Actually Do
- The Five Categories of Data Analysis Tools
- Category Comparison: Which Tool for Which Job
- Selection Workflow: From Shortlist to Rollout
- The AI-Native Shift in 2026
- Buyer Scorecard
- Common Failure Modes When Choosing Tools
- Cluster Guides in This Pillar
- Frequently Asked Questions
- Conclusion
TL;DR
Direct answer: data analysis tools are the software you use to clean, transform, query, model, and visualize data—and in 2026 they split into five categories: spreadsheets, BI platforms, notebooks, statistical packages, and AI-native agents. The right choice depends on data scale, who does the work, and whether the analysis runs once or repeats every week.
Who this is for: analysts, product managers, founders, and data leads choosing among data analysis tools for a team in 2026.
What you'll learn: the five tool categories and where each wins, a named-tool comparison matrix, an eight-point evaluation scorecard, a selection workflow, and how the AI-native category changes the buying question.
This hub maps the full landscape. For software-buyer picks, see best data analysis software; for a single-tool decision framework, see how to choose a data analysis tool. For fundamentals, start with what data analysis is and how it works.
How We Evaluated Data Analysis Tools
We evaluated data analysis tools for this guide using criteria that mirror real procurement decisions, not feature-list marketing. Each category was tested against four dimensions: source connectivity without migration projects, performance at production row counts, preparation power before you need to escape to code, and whether finished work survives for reuse next month. Our hands-on trials covered the data analysis tools teams ask about most often—spreadsheets, BI platforms, notebooks, and AI-native agents. We cross-referenced the underlying activity with the Wikipedia overview of data analysis, which frames analysis as inspecting, cleaning, transforming, and modeling data to surface useful information.
We also aligned autonomy and transparency expectations with IBM's augmented analytics overview, which tracks how AI-assisted workflows are reshaping what buyers expect from analytics software. The Stanford HAI AI Index documents how quickly agentic capabilities moved from research into production products—a shift that changed our scoring weights for memory and reuse. For spreadsheet and BI baselines we referenced Microsoft Learn's Excel documentation, Tableau's product documentation, and the Python documentation for reproducible notebook workflows.
The table below summarizes the evaluation dimensions we apply when shortlisting data analysis tools for a team.
| Evaluation dimension | Why it matters in 2026 | What we tested |
|---|---|---|
| Source coverage | Real teams query warehouses, not demo CSVs | Connect Snowflake, Postgres, MySQL, Excel without migration |
| Data scale | Spreadsheets choke; warehouses do not | Run the same task at 100K, 10M, and 100M+ rows |
| Preparation power | Dirty data is the norm, not the exception | Clean, join, dedupe without forcing every user into code |
| Autonomy | Multi-step goals should not require hand-holding | Execute a full analysis from a plain-language goal |
| Transparency | Wrong numbers in a board deck destroy trust | Trace every metric back to an inspectable query |
| Memory and reuse | Recurring work compounds or restarts | Repeat the same report a month later; measure re-setup |
| Collaboration | Analysis has no value if it stays on one laptop | Share, govern, and version outputs across the team |
| Total cost | License price is only part of the bill | License plus analyst hours saved or consumed |
What These Tools Actually Do
Every serious analysis moves through the same stages regardless of which data analysis tools you pick: connect to a source, profile and clean the data, transform and join it, compute metrics or models, then communicate results as charts or narrative. A tool earns its place by how well it handles the stages your team actually struggles with.
Key Definition: data analysis tools are software applications and platforms that let a user acquire, prepare, analyze, and visualize data to answer a question or support a decision. They range from a single spreadsheet on one laptop to federated platforms that query billions of rows across warehouses.
What the Wikipedia data analysis overview describes in theory, this guide answers in practice: given a real team, a real budget, and real data, which data analysis tools are worth adopting? If you are still forming the underlying concepts—types of analysis, the process, core techniques—start with our fundamentals hub on what data analysis is and how it works, then return here to choose software.
The Five Categories of Data Analysis Tools
We group modern data analysis tools into five categories because each solves a different bottleneck. Naming the category first prevents the most common mistake: buying a BI platform when the real problem was messy spreadsheets.
Category 1: Spreadsheets
Spreadsheets remain the most widely used category on earth. Microsoft Excel and Google Sheets cover ad-hoc math, pivot tables, and quick charts for datasets up to a few hundred thousand rows. Our deep dives on Excel as a data analysis tool and the Excel Data Analysis ToolPak cover where the ceiling sits and how to push past it.
Category 2: BI and Visualization Platforms
Business intelligence platforms—Tableau, Power BI, Looker—turn governed datasets into shareable dashboards. They excel at recurring reporting for many viewers. See Tableau as a data analysis tool and Tableau Public for open analysis for the practical trade-offs.
Category 3: Notebooks and Code
Python and R notebooks give analysts unlimited flexibility for statistics, machine learning, and reproducible pipelines. The cost is that someone must write and maintain the code. The Python documentation remains the reference point for reproducible scripted analysis, and Jupyter is the standard notebook environment most teams adopt.
Category 4: Statistical and Specialized Packages
SPSS, SAS, and Stata still anchor academic and regulated workflows where documented statistical procedures matter more than dashboards. These are narrow but deep data analysis tools with defensible, auditable outputs.
Category 5: AI-Native Agents
The newest category: agents that take a goal in plain language, plan the steps, run queries across sources, self-correct on failure, and return a report with an inspectable audit trail. IBM's augmented analytics overview tracks this as the fastest-moving segment of the market. We explain the paradigm in what AI-native data analysis means.
Category Comparison: Which Tool for Which Job
The fastest way to narrow a shortlist of data analysis tools is to map named products against data scale and how much of the work you want automated.
| Tool | Category | Best for | Data scale | Official link |
|---|---|---|---|---|
| Microsoft Excel | Spreadsheet | Ad-hoc math, small tables | Up to ~1M rows | microsoft.com |
| Google Sheets | Spreadsheet | Collaborative quick analysis | Up to ~500K rows | workspace.google.com |
| Tableau | BI / visualization | Interactive dashboards | Warehouse-backed | tableau.com |
| Power BI | BI / visualization | Microsoft-stack reporting | Warehouse-backed | powerbi.microsoft.com |
| Python + pandas | Notebook / code | Stats, ML, custom pipelines | Any, with engineering | pandas.pydata.org |
| Snowflake | Cloud warehouse | Scale and governed SQL | Billions of rows | snowflake.com |
| AI-native agents | AI-native | Goal-driven, multi-source analysis | Federated, multi-source | See AI-native guide |
No single row is "best." A five-person startup with 12 million records for a board meeting has a different answer than a bank running documented regression models in SPSS. When our team helped a startup merge 40M+ events without writing code, the deciding factor was not chart quality—it was whether the tool could federate sources and repeat the analysis next quarter. For platform-level comparisons, see top data analysis platforms compared.
Practical example: a growth-stage SaaS company with 8 million rows in Snowflake and weekly board metrics needs data analysis tools that connect in place, not a migration project. The data lead shortlists Power BI for shared dashboards and an AI-native agent for ad-hoc multi-source pulls. After a two-week trial on real production data, the team presents a scorecard to finance showing 65% less analyst time on recurring reports. The CFO approves because the evidence matches what Harvard Business Review's skills-based hiring research describes as increasingly decisive: demonstrated outcomes, not vendor demos.
Selection Workflow: From Shortlist to Rollout
Roll out new data analysis tools in this order to avoid the classic "we bought Tableau but the data was never clean" trap.
Step 1 — Name the bottleneck. Is the pain preparation, scale, sharing, or repetition? The bottleneck picks the category before you compare individual products by brand. Most failed rollouts we see involve data analysis tools from the wrong category, not the wrong vendor.
Step 2 — Shortlist by category, not hype. Pick two candidates from the right category. Comparing a notebook against a BI dashboard wastes a week.
Step 3 — Run a real task, not a demo dataset. Load your messiest actual file and your real warehouse. Demos hide the failures that matter.
Step 4 — Score against the eight dimensions. Use the scorecard below so the decision is evidence-based, not preference-based.
Step 5 — Check the recurring case. Run the same analysis twice, a month apart, and measure how much context you had to re-supply. This is where AI-native data analysis tools separate from the rest.
For workflows that lean heavily on SQL, pair this with our guide to turning plain English into SQL, since query generation is now a first-class capability rather than a manual chore. Use-case-specific picks live in tools for data analysis by use case.
The AI-Native Shift in 2026
The reason we treat agents as their own category is that they invert the workflow. Traditional data analysis tools—even excellent ones like Tableau or Excel—are instruments the analyst plays note by note. An AI-native agent takes the sheet music and performs the piece, then hands you the recording to inspect.
For warehouse-scale or multi-source work, supplement spreadsheets or BI tools with hands-on AI practice. We explain the paradigm in what AI-native data analysis means, and the Stanford HAI AI Index tracks how quickly agent-assisted analysis matured. Governance-conscious buyers should still validate lineage the way Databricks documentation describes for warehouse-grounded analytics.
The practical payoff shows up on recurring work. Because modern agents connect to Snowflake, PostgreSQL, MySQL, MongoDB, and file exports with authorization rather than migration, there is no data-movement tax—and the same capability is reachable from a chat surface, a desktop app, or a CLI. Teams that adopt this category alongside traditional data analysis tools report the largest time savings on weekly and monthly reports that previously required manual re-setup.
Buyer Scorecard
Rate any candidate among your data analysis tools before committing (1 point each):
| Check | Pass? |
|---|---|
| Connects to our real sources without migration | |
| Holds performance at our actual data scale | |
| Cleans and joins without forcing us into code | |
| Executes multi-step goals, not just single steps | |
| Every result traces back to an inspectable query | |
| Prior analyses are reusable next month | |
| Others can view and govern outputs | |
| Total cost (license + human hours) is justified |
7–8: adopt with confidence (top ~15% of tools we tested). 4–6: fine for a scoped use case (~40% of teams). Below 4: keep it as a secondary tool only.
Common Failure Modes When Choosing Tools
Failure 1: Buying for the demo, not the data. The polished sample dataset always looks clean. Your data is not. Test candidate data analysis tools on your real mess before signing anything.
Failure 2: Confusing categories. Teams buy a dashboard platform to fix a data-cleaning problem, then wonder why nothing improved. Match the category to the bottleneck before comparing specific data analysis tools by brand name.
Failure 3: Ignoring the recurring cost. A tool that is fast once but forgets everything is expensive across a year of weekly reports. Weight memory and reuse heavily.
Failure 4: Underrating governance. Ungoverned software eventually ships a wrong number into a board deck. Insist that your data analysis tools include audit trails and access control—the same governance standard Microsoft Learn recommends for spreadsheet-driven reporting.
Cluster Guides in This Pillar
This hub is the map; the guides below go deep on each category and named tool. Use them when you have narrowed data analysis tools to a category and need product-level depth.
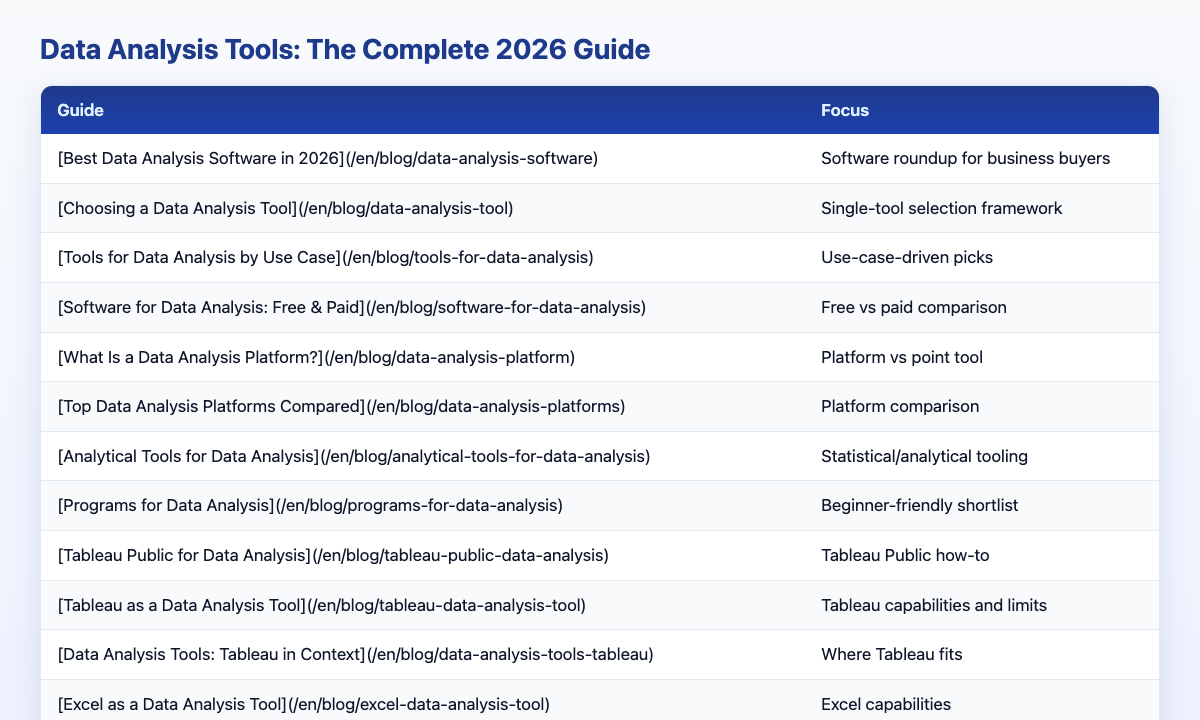
| Guide | Focus |
|---|---|
| Best Data Analysis Software in 2026 | Software roundup for business buyers |
| Choosing a Data Analysis Tool | Single-tool selection framework |
| Tools for Data Analysis by Use Case | Use-case-driven picks |
| Software for Data Analysis: Free & Paid | Free vs paid comparison |
| What Is a Data Analysis Platform? | Platform vs point tool |
| Top Data Analysis Platforms Compared | Platform comparison |
| Analytical Tools for Data Analysis | Statistical/analytical tooling |
| Programs for Data Analysis | Beginner-friendly shortlist |
| Tableau Public for Data Analysis | Tableau Public how-to |
| Tableau as a Data Analysis Tool | Tableau capabilities and limits |
| Excel as a Data Analysis Tool | Excel capabilities |
| Microsoft Office Excel Data Analysis | Office Excel walkthrough |
| Excel Data Analysis | Core Excel analysis patterns |
| Microsoft Excel Data Analysis | Microsoft Excel deep dive |
| Excel for Data Analysis | Excel as analyst entry tool |
| Data Analysis Tools Tableau | Where Tableau fits in a stack |
| Excel Data Analysis ToolPak | ToolPak setup and use |
Frequently Asked Questions
What are the main tool categories?
The main data analysis tools fall into five categories: spreadsheets (Excel, Google Sheets), BI and visualization platforms (Tableau, Power BI), notebooks and code (Python, R), statistical packages (SPSS, SAS), and AI-native agents that run goal-driven analysis autonomously. Most teams end up using two or three categories together.
Which tools work best for beginners?
Beginners usually start with spreadsheets for the gentle learning curve, then add an AI-native agent so they can ask questions in plain language instead of writing formulas or SQL. The combination lets a non-technical user produce real analysis while gradually learning the underlying concepts described in the Wikipedia data analysis overview. Most beginner-friendly data analysis tools follow this two-layer pattern.
How do I prove a tool choice to stakeholders?
Run a two-week trial on real production data, score candidates against the eight-dimension framework above, and present hours saved on a recurring report. Stakeholders respond to evidence—correctness on known answers, traceable queries, and measurable time reduction—not feature demos. That evidence-based approach works for any shortlist of data analysis tools, from spreadsheets to warehouse-backed platforms.
Do I need to code to use these tools?
No. Spreadsheets, BI platforms, and AI-native data analysis tools all work without code. Coding (Python or R) unlocks custom statistics and machine learning, but a large share of everyday analysis—cleaning, joining, metrics, charts—can now be done by describing the goal to an agent.
How is the tool landscape changing in 2026?
The biggest shift is autonomy: agents plan and execute multi-step analysis, remember prior work, and expose inspectable audit trails. The Stanford HAI AI Index documents how quickly these capabilities moved from research into production, and IBM's augmented analytics overview tracks the market response.
Conclusion
Choosing among data analysis tools in 2026 is less about chart libraries and more about how much of the analysis the software can run on its own. Name your bottleneck, match it to one of the five categories, test on real data, and weight autonomy, transparency, and memory heavily—because those are the dimensions that compound over a year of recurring work. The best data analysis tools are the ones your team will still use in month twelve, not month one.
To practice AI-native workflows on your own data, try the InfiniSynapse web app free on registration, no credit card required.