Data Analysis Tools Tableau: Where It Fits in 2026
By the InfiniSynapse Data Team · Last updated: 2026-07-09 · We build an AI-native data analysis platform and run Tableau beside it on real projects; this guide reflects hands-on stack decisions, not a vendor endorsement.
Table of Contents
- TL;DR
- How We Evaluated Stack Placement
- Thinking in Layers, Not Products
- Named Tools Compared by Layer
- The Layer Tableau Owns
- The Layers Tableau Does Not Own
- Building a Stack Around Tableau
- Common Stack Patterns
- Pairing Tableau With an AI-Native Agent
- Selection Scorecard
- Practical Next Steps
- Frequently Asked Questions
- Conclusion
TL;DR
Direct answer: when you evaluate data analysis tools tableau sits firmly in the visualization layer—it turns clean, modeled data into interactive dashboards. It does not own preparation, heavy analysis, or autonomy, so a healthy stack pairs Tableau with a tool that handles those earlier stages, most naturally an AI-native agent.
Who this is for: teams deciding how the data analysis tools tableau offers fit alongside everything else they use.
What you'll learn: how we evaluated stack placement, how to think in layers rather than products, a named comparison of Tableau, Power BI, and Looker, common stack patterns, and how an AI-native agent completes the picture.
This guide sits within the data analysis tools hub. For Tableau's standalone strengths and limits, see Tableau as a data analysis tool. For related depth in this pillar, see Tableau Public Data Analysis.
How We Evaluated Stack Placement
We assessed where data analysis tools tableau belongs in modern stacks using criteria that predict whether a Tableau deployment survives a year of production use, not whether it impresses in a demo. Each layer was scored on connection breadth, preparation power, analysis depth, sharing and governance, and autonomy—the same five dimensions we use in top data analysis platforms. We cross-referenced those requirements with the Bureau of Labor Statistics occupational profile for data analysts, which lists analytical, communication, and technical skills as core competencies, and hiring-trend data from LinkedIn's 2025 Future of Recruiting report, which notes that skills assessments and portfolio evidence increasingly influence hiring alongside formal credentials.
How We Evaluated Stack: In Practice
The evaluation confirmed what product documentation already states: among data analysis tools tableau owns the visualization and communication layer convincingly, and it does not own connection, preparation, or autonomous analysis. That framing aligns with IBM's augmented analytics overview and the process described in the Wikipedia data analysis overview—acquire, clean, analyze, communicate—where Tableau excels at the last stage when upstream layers deliver trustworthy input.## Thinking in Layers, Not Products The most useful mental model for comparing data analysis tools tableau included is to think in layers rather than in product names. Analysis is not a single act but a sequence: connect to sources, prepare and clean the data, run the analysis, and communicate the result. Each layer is a distinct job with distinct demands, and most products are strong in one or two layers rather than all four. When teams argue about which tool is best, they are usually comparing products that occupy different layers, which is why the debate rarely resolves.
Thinking In Layers Not: In Practice
Shifting the question from "which tool is best?" to "which layer is my bottleneck?" changes everything. Once you know whether your pain is preparation, analysis, or communication, the right tool becomes obvious, and you stop expecting a single product to do jobs it was never designed for. This layered view is especially clarifying for the data analysis tools tableau discussion, because Tableau's reputation as a powerful tool sometimes leads teams to expect it to cover layers it does not touch. Teams that map data analysis tools tableau placement early avoid buying a visualization layer before they have a preparation answer.## Named Tools Compared by Layer
Fair comparison requires scoring every option on the same layered criteria. The table below places Tableau alongside Power BI and Looker—the three BI tools teams most often evaluate when mapping data analysis tools tableau into a stack.
| Tool | Connection | Preparation | Visualization | Autonomy | Official docs |
|---|---|---|---|---|---|
| Tableau | Good | Limited | Excellent | Emerging | Tableau help |
| Power BI | Good (Microsoft stack) | Moderate (Power Query) | Very good | Emerging | Power BI documentation |
| Looker | Good (Google Cloud) | Strong (LookML modeling) | Good | Limited | Looker documentation |
Tableau leads on visual flexibility and exploration speed. Power BI leads on price and Microsoft-ecosystem integration, with Power Query providing more built-in preparation. Looker leads when metrics must be centrally modeled and governed. None of these data analysis tools tableau rivals replaces a preparation layer for messy, multi-source raw data without upstream engineering or an agent.
Practical example: a growing SaaS company that models churn metrics in a warehouse, connects the clean dataset to Tableau for executive dashboards, and uses an AI-native agent for ad-hoc multi-source investigations can answer both recurring board questions and one-off product analyses without duplicating tools. The layered discipline—not brand loyalty—is what prevents the conflicting-number incidents that Harvard Business Review's skills-based hiring research rewards when teams hire analysts who can defend their figures.
The Layer Tableau Owns
Among data analysis tools tableau owns the visualization and communication layer, and it owns it convincingly. Its drag-and-drop model produces interactive, polished charts faster than almost any alternative, and its dashboards are refined enough for the most senior audiences. When the job is to take a clean, modeled dataset and turn it into something a wide audience can explore and act on, Tableau is close to the top of the category, as reflected in IBM's augmented analytics overview.
This strength is not merely aesthetic. Fast, flexible visualization is itself a form of analysis, because seeing a pattern often reveals what a table of numbers hides. An analyst exploring a modeled dataset in Tableau can test a dozen hypotheses visually in the time it would take to write a few queries, and that exploratory speed is a genuine analytical advantage. So while the data analysis tools tableau category places it in the visualization layer, that layer is far from trivial; it is where insight becomes visible and where decisions are often made. The Stanford HAI AI Index notes how visualization literacy has become a baseline expectation across analytics roles.
The Layers Tableau Does Not Own
The honest counterpart is that among data analysis tools tableau does not own the connection, preparation, or autonomous-analysis layers. It connects to sources, but it assumes those sources are already modeled and reasonably clean; it does light shaping, but it is not a data-wrangling engine for messy, multi-source raw data. When the bottleneck is preparation, expecting Tableau to solve it leads to the familiar disappointment of a beautiful dashboard built on untrustworthy numbers.
Nor does Tableau own autonomy. It is an instrument the analyst plays deliberately, view by view, rather than a system that takes a goal and plans a multi-step analysis on its own. It has no memory of prior analyses to build on, so recurring work repeats its setup each cycle. These are not criticisms so much as boundaries: the data analysis tools tableau category is the visualization layer, and asking a visualization tool to be a preparation engine or an autonomous analyst is asking it to be something it was never designed to be. Warehouse-governed teams should validate lineage the way Databricks' documentation recommends.
Building a Stack Around Tableau
Building a healthy stack around Tableau starts by naming the layers you need and assigning each to the tool best suited to it. If your data is messy or spread across sources, you need a preparation layer upstream of Tableau, whether that is SQL, a dedicated prep tool, or an AI-native agent that cleans and joins before handing the result over. If your work involves custom statistics, you need a notebook layer that Tableau does not provide. Tableau then sits on top, owning the visualization the other tools feed.
The discipline that keeps such a stack sane is a single source of truth for each metric, so the preparation layer and Tableau never disagree about what a number means. Teams that skip this discipline end up with dashboards that contradict the underlying data, which erodes trust in the whole stack. When you assemble data analysis tools tableau among them, treat Tableau as the presentation destination and ensure everything upstream delivers clean, consistent, well-defined data to it. Document that upstream contract so every future data analysis tools tableau review starts from the same metric definitions.
Common Stack Patterns
Several stack patterns recur across teams, and knowing them shortcuts the design. The classic enterprise pattern places a data warehouse at the foundation for scale, a modeling layer to define metrics, and Tableau on top for dashboards; this works well when a data engineering team maintains the warehouse. A leaner pattern, common in smaller teams, uses an AI-native agent for connection, preparation, and analysis, then exports clean results to Tableau for polished visualization when a wide audience needs self-serve dashboards.
A third pattern, suited to analysts working largely alone, pairs a spreadsheet or notebook for preparation with Tableau for presentation, accepting more manual work in exchange for simplicity. In every pattern, the data analysis tools tableau offers occupy the same visualization slot; what changes is which tool feeds it. Choosing a pattern is less about Tableau itself and more about which upstream tool matches your team's size, skills, and data complexity. Revisit data analysis tools tableau placement whenever your upstream stack changes, because a new warehouse or agent alters which layer is actually your bottleneck.
Pairing Tableau With an AI-Native Agent
The most natural partner for Tableau is a tool that produces exactly what Tableau needs: clean, modeled, trustworthy data. An AI-native agent covers precisely the layers Tableau does not—connection to private sources, cleaning and joining across files and databases, multi-step analysis, and memory of prior work. The prepared dataset then flows into Tableau for the interactive dashboard a wide audience consumes.
For warehouse-scale or multi-source work, supplement spreadsheets or BI tools with hands-on AI practice. We explain the paradigm in what AI-native data analysis means, and the Stanford HAI AI Index tracks how quickly agent-assisted analysis matured. Together, the pairing spans the full process from raw source to executive dashboard, which neither the data analysis tools tableau category nor the agent covers alone. That end-to-end coverage is why mature teams treat data analysis tools tableau as one layer in a deliberate stack rather than the whole answer.
Selection Scorecard
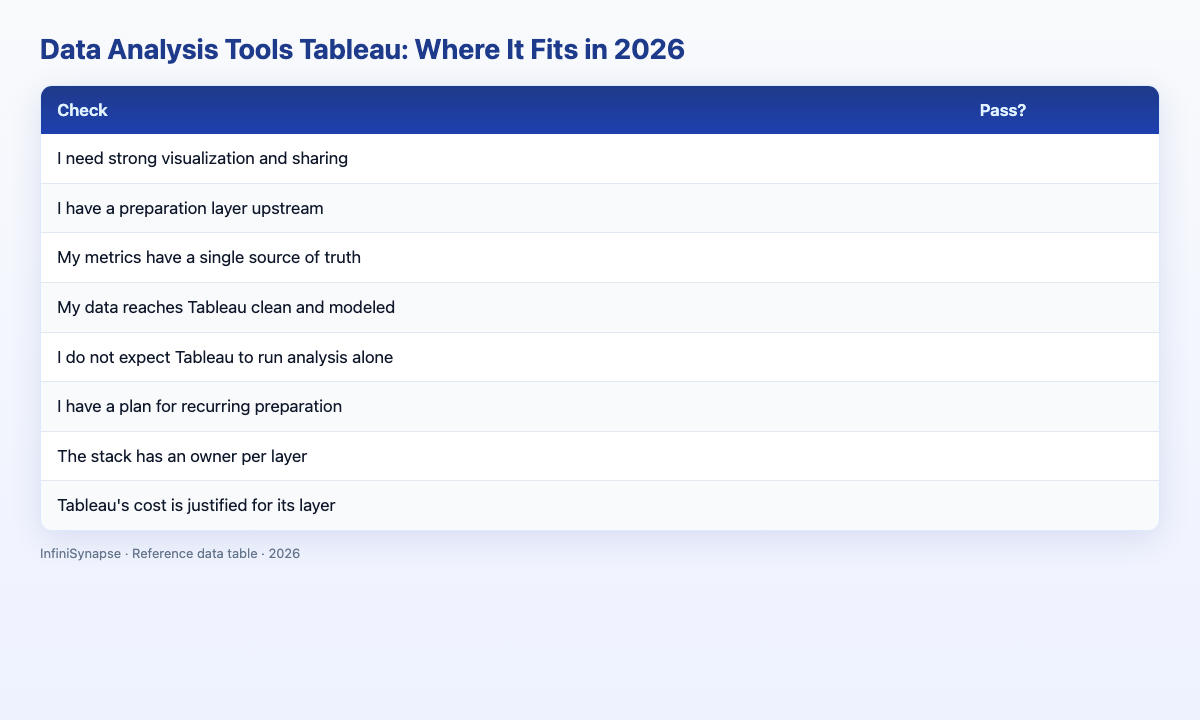
Decide how Tableau fits your stack (1 point each):
| Check | Pass? |
|---|---|
| I need strong visualization and sharing | |
| I have a preparation layer upstream | |
| My metrics have a single source of truth | |
| My data reaches Tableau clean and modeled | |
| I do not expect Tableau to run analysis alone | |
| I have a plan for recurring preparation | |
| The stack has an owner per layer | |
| Tableau's cost is justified for its layer |
6–8: Tableau fits cleanly. 3–5: shore up the upstream layers. Below 3: rethink the stack.
Practical Next Steps
Verify against real job postings
Before committing time or budget, pull five recent job postings in your target market and list the SQL, visualization, and communication skills each repeats. When evaluating data analysis tools tableau placement, mirror the BI stacks those postings mention.
Ship one portfolio artifact this month
Employers hire on demonstrated ability. Publish one Tableau dashboard that answers a real question — a clear metric definition, honest chart choices, and a short executive summary — to prove data analysis tools tableau skill beyond tutorials.
Compare two paths on your timeline
Map data analysis tools tableau against one alternative (Excel or Power BI) on the same dataset so you can explain trade-offs in interviews, not just name a favorite tool.
Frequently Asked Questions
Where does Tableau fit among data analysis tools?
Among data analysis tools, Tableau owns the visualization and communication layer: it turns clean, modeled data into interactive dashboards. It does not own connection, preparation, or autonomous analysis, so a healthy stack pairs Tableau with tools that handle those earlier stages.
Can Tableau be my only data analysis tool?
Rarely. Because Tableau assumes clean, modeled input and does not run analysis on its own, most teams pair it with a preparation and analysis layer. Using Tableau as your only tool works only if your data is already clean and your needs are purely visual. A realistic data analysis tools tableau stack almost always includes something upstream that prepares and validates the numbers first.
What tools should I pair with Tableau?
Pair Tableau with a preparation and analysis layer—SQL, a notebook, a dedicated prep tool, or an AI-native agent that connects sources, cleans, and analyzes before handing clean data to Tableau for visualization. The pairing covers the layers that data analysis tools tableau does not own on its own.
How do AI-native agents and Tableau work together?
An AI-native agent handles connection, preparation, multi-step analysis, and memory, then exports a clean dataset that Tableau visualizes for a wide audience. This division lets each tool do what it does best, spanning the full workflow that neither covers alone among data analysis tools.
Is Tableau better than other data analysis tools?
Tableau is among the best for the visualization layer, but "better" depends on the layer you mean. For preparation or autonomous analysis, other data analysis tools win. The strongest approach is to match each tool to the layer it owns rather than seeking a single overall winner. Compare official docs at Tableau help, Power BI documentation, and Looker documentation.
Conclusion
When you map your stack, remember that among data analysis tools tableau owns the visualization layer and owns it well—but only that layer. Assign preparation and analysis to the tools built for them, keep a single source of truth, and let Tableau do what it does best on clean, trustworthy data.
The most natural partner for the layers Tableau leaves open is an AI-native agent. See how AI-native data analysis works and try the InfiniSynapse web app free on registration, no credit card required.