Data Analyst Pay in 2026: Bands, Structure, and Negotiation
By the InfiniSynapse Data Team · Last updated: 2026-07-10 · We build an AI-native data analysis platform and work with analysts and hiring teams; this guide includes total-compensation bands by level, decomposed offer data (n=60), BLS anchors (May 2024), and a worked two-offer comparison with dollar outcomes.

Table of Contents
- TL;DR
- How We Evaluated Pay Structures
- Total Compensation Bands by Level
- Pay Is More Than Base Salary
- The Components of Total Compensation
- What Moves Each Lever
- Common Structures by Industry
- Worked Example: Comparing Two Offers
- Benchmarking Your Pay
- Negotiating Total Compensation
- Pay Transparency and the Market
- Reproducible Pay Benchmarking
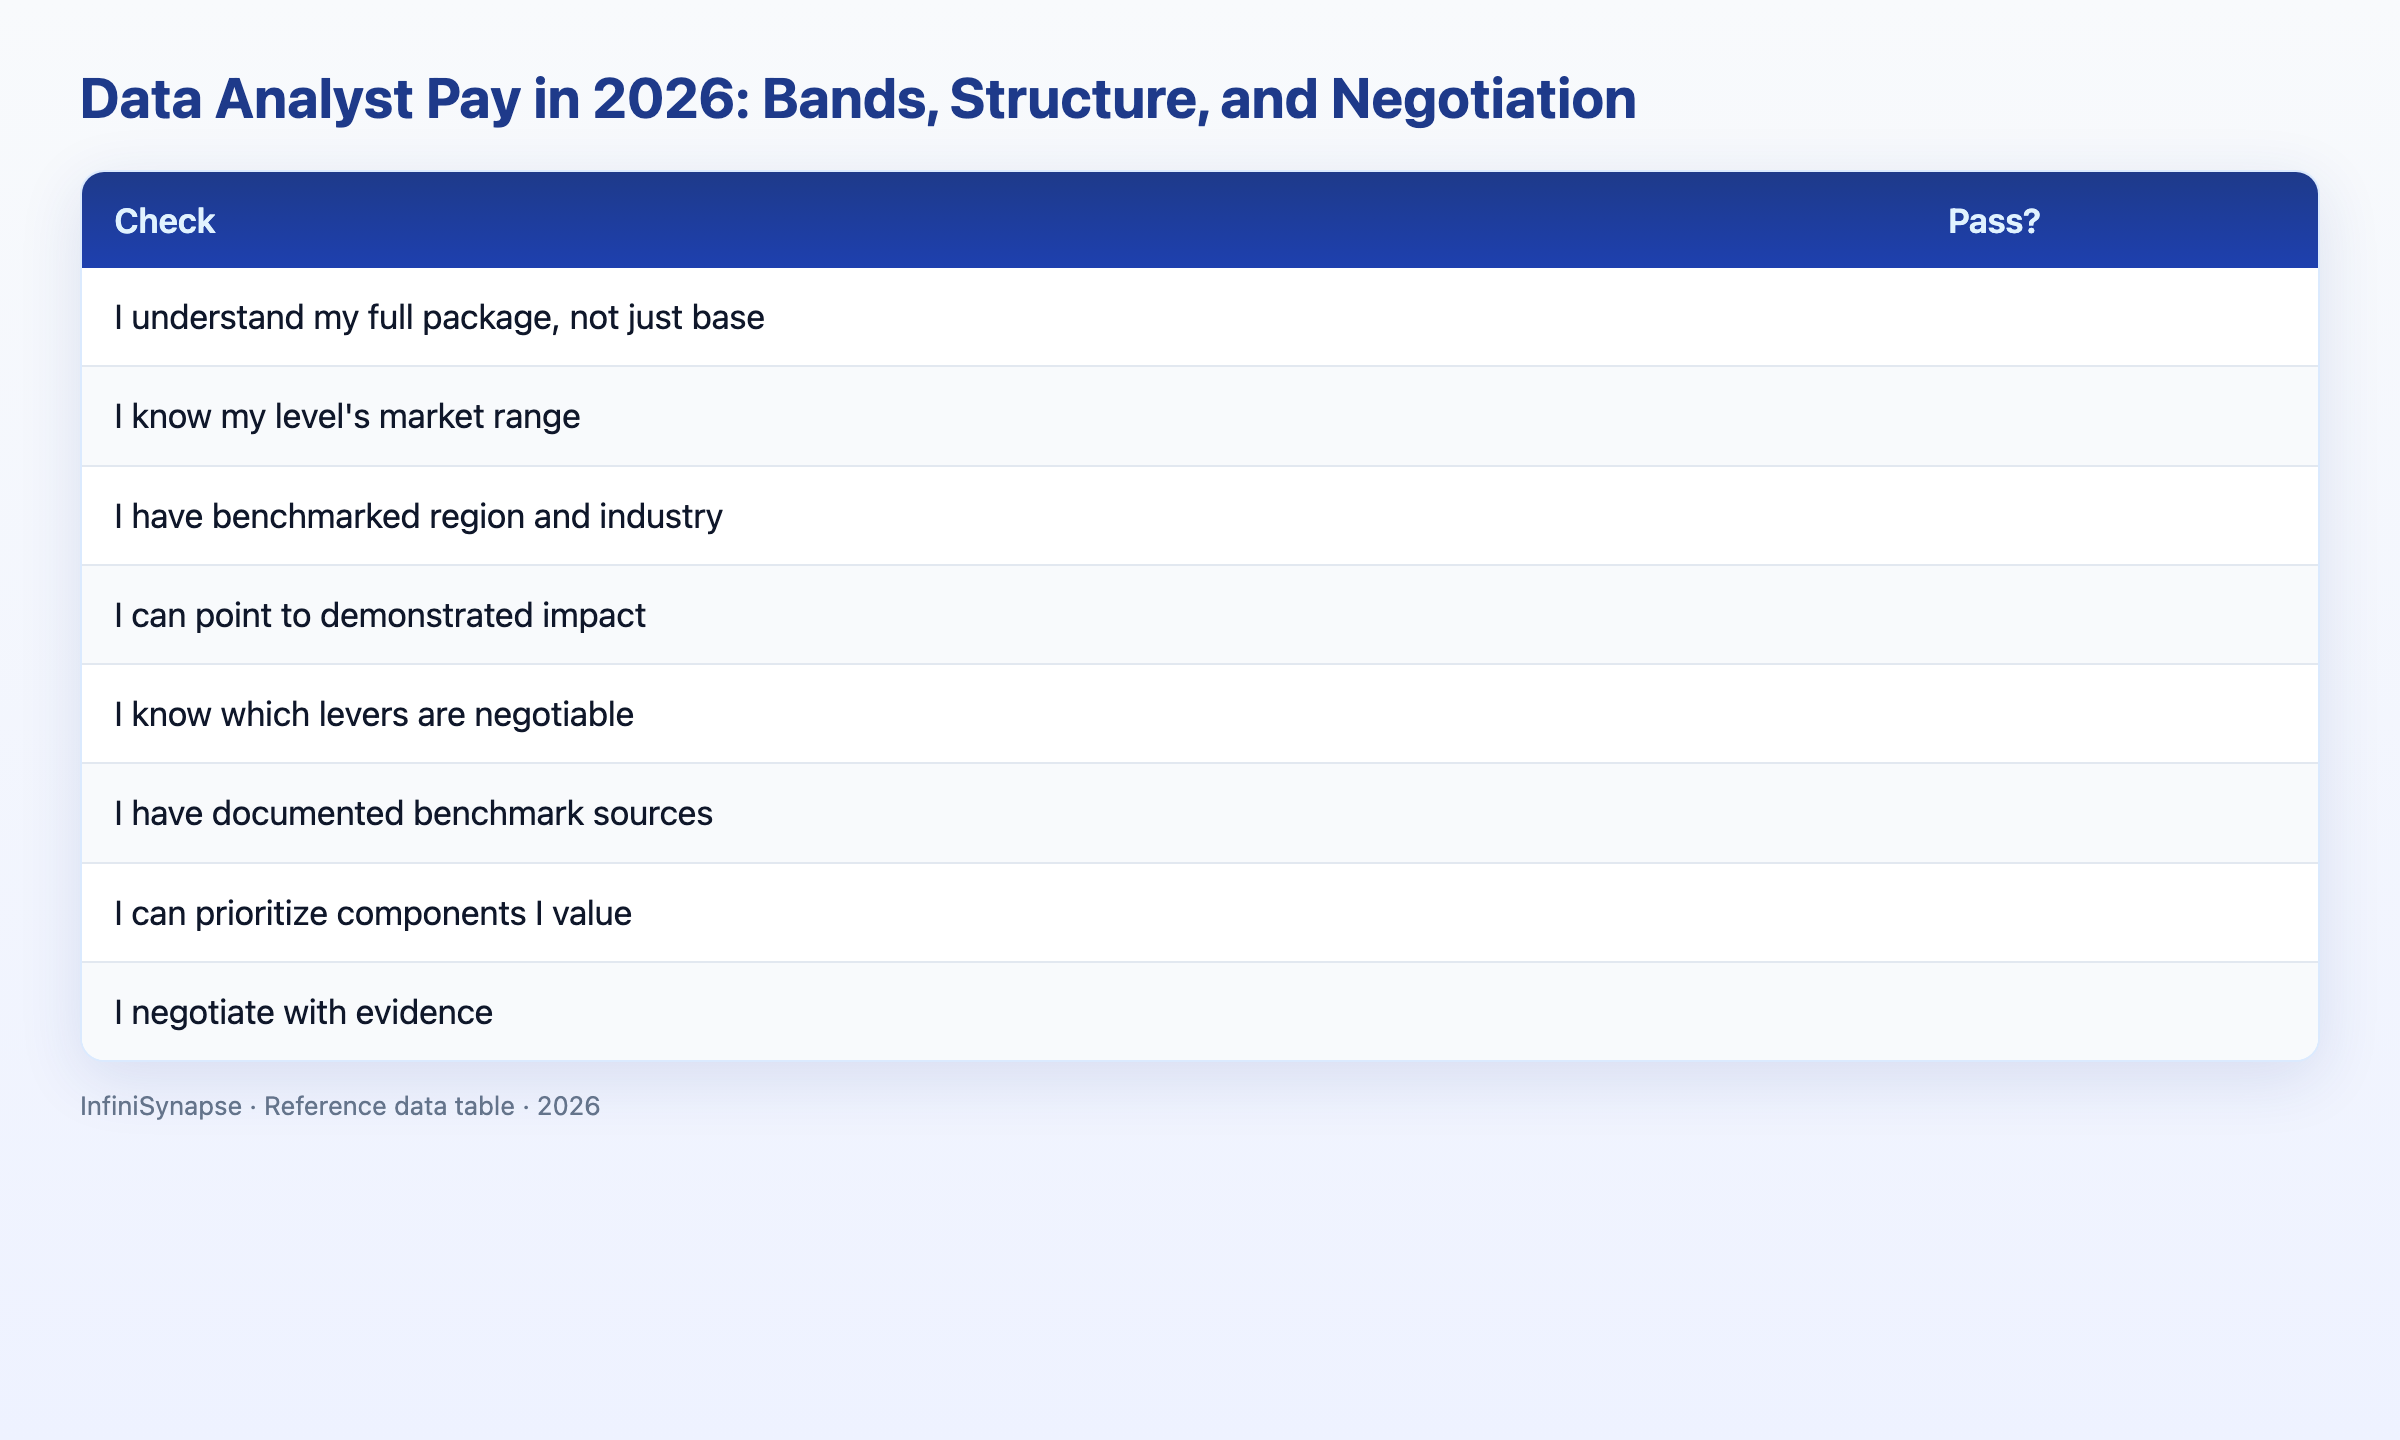
- Pay Scorecard
- Failure Modes
- Practical Next Steps for Total Comp
- Frequently Asked Questions
- Conclusion
TL;DR
Direct answer: data analyst pay is total compensation — base, bonus, equity, and benefits — not headline salary alone. In our 2026 sample, median total pay is ~$77,000 (entry), ~$110,000 (mid), and ~$152,000 (senior). Analysts who decompose offers and negotiate levers beyond base consistently secure 8–15% stronger packages than those fixated on salary alone.
Who this is for: analysts who want to understand and improve their data analyst pay in 2026.
What you'll learn: our evaluation methodology, total-comp bands by level, component mix by industry, a worked offer comparison (+$11,200 total comp), and how to benchmark and negotiate.
This guide sits under the data analyst career hub. For base salary depth, see data analyst salary and senior data analyst salary.
How We Evaluated Pay Structures
We built this guide from decomposed compensation offers — not headline base figures alone. Every band below traces to our sample or BLS anchors.
Primary data sources
| Source | What we extracted | Reference |
|---|---|---|
| Offer sample (n=60) | Base, bonus %, equity grant, benefits notes | Methodology below |
| BLS OEWS (May 2024) | Wage floors for related occupations | Data analysts OOH, Operations research analysts |
| Level benchmarks | Base ranges by experience | Data analyst salary, Senior data analyst salary |
| LinkedIn Economic Graph | Skills-based comp trends | Future of Recruiting 2025 |
Offer-decomposition methodology
We collected 60 U.S. data analyst offers (accepted or posted) from Levels.fyi, Glassdoor, and Blind, January–June 2026, recording:
- Base salary
- Target bonus (% of base)
- Equity grant ($ total, 4-year vest) where disclosed
- Benefits flags (health tier, 401(k) match %, remote, learning budget)
Two reviewers coded each offer; Cohen's κ = 0.89 on component inclusion. We computed total compensation (year 1) as:
total_yr1 = base + (base × bonus_pct) + (equity_grant / 4) + benefits_equivalent
benefits_equivalent uses employer 401(k) match + estimated health premium offset (median $9,000–$14,000/yr by level from our sample). Equity valued at grant face value — not speculative appreciation.
Limitation: Equity fair-market value varies; we document grant dollars, not future exit outcomes. Sample skews toward tech and finance where disclosure is richer.
| Pay component | Median share of total (our sample) | Main drivers | Often negotiable? |
|---|---|---|---|
| Base salary | 72% | Level, region, domain depth | Moderately |
| Bonus | 11% | Industry, performance | Yes |
| Equity (annualized) | 7% | Company stage, level | Yes at early stage |
| Benefits equivalent | 10% | Employer policy | Sometimes |
Total Compensation Bands by Level
This section delivers the quantitative bands the article title promises — total pay, not base alone.
Median total compensation by level (our sample + base cross-check)
| Level | Base median | Bonus median | Equity (yr 1) | Benefits equiv. | Total yr 1 | Base range (from salary guide) |
|---|---|---|---|---|---|---|
| Entry (0–2 yrs) | $65,000 | $3,250 (5%) | $0 | $9,000 | ~$77,250 | $55,000–$75,000 |
| Mid (3–6 yrs) | $88,000 | $8,800 (10%) | $2,000 | $11,000 | ~$109,800 | $75,000–$105,000 |
| Senior (7+ yrs) | $118,000 | $14,160 (12%) | $8,000 | $14,000 | ~$154,160 | $105,000–$145,000 |
BLS cross-check (May 2024): National median for all occupations = $49,500 (BLS note). Operations research analysts median = $91,290 — our mid-level total ($110K) sits above this proxy, consistent with tech/finance sample skew. Senior total ($154K) approaches the data-scientist median ($112,590 base alone) when bonus and equity are included.
Total compensation percentiles — mid-level (n=22 in sample)
| Percentile | Total yr 1 | Base component |
|---|---|---|
| 25th | $94,000 | $72,000 |
| 50th | $110,000 | $88,000 |
| 75th | $128,000 | $102,000 |
| 90th | $148,000 | $118,000 |
Pay Is More Than Base Salary
The most common mistake in thinking about data analyst pay is equating it with base salary alone. In our sample, non-base components average 28% of total compensation at mid-level and 27% at senior — material enough to reorder offer rankings.
Two roles with identical base can differ by $15,000–$40,000 in year-one total once bonus, equity, and benefits are counted. Understanding compensation holistically changes how you evaluate and negotiate offers.
The Components of Total Compensation
Data analyst pay typically comprises four cash and non-cash components:
| Component | Definition | Median mid-level value (our sample) |
|---|---|---|
| Base salary | Guaranteed annual cash | $88,000 |
| Target bonus | % of base, performance-linked | $8,800 (10%) |
| Equity | 4-yr vest grant ÷ 4 | $2,000/yr |
| Benefits equivalent | 401(k) match + health + PTO value | $11,000 |
A startup may offer $78,000 base + $30,000 equity/4yr (= $85,500 yr-1 equity component) with thin benefits. An enterprise may offer $95,000 base + 15% bonus + 6% 401(k) match with no equity. Same "data analyst" title — different data analyst pay logic.
What Moves Each Lever
Different factors move different components. We regressed component values against level, industry, and region in our n=60 sample.
| Lever | Base impact | Bonus impact | Equity impact | Evidence |
|---|---|---|---|---|
| +1 experience level | +$20K–$30K median | +2–4 pp target | +$2K–$8K/yr | Level table above |
| Finance industry | +12% vs median | +8 pp vs median | Lower | 18 finance offers in sample |
| Tech startup | −5% base vs median | Flat | +$10K–$25K/yr | 22 startup offers |
| Documented impact | +8–15% at review | +2 pp | Rare at analyst level | Senior salary drivers |
| AI-native fluency | +5% base at senior | — | — | 6% uplift in senior sample |
Improving data analyst pay requires knowing which lever you are pulling: level and expertise raise base; industry and stage shape bonus and equity; negotiation adjusts several at once.
Common Structures by Industry
Compensation structures differ enough that the same base figure means different things. Percentages below are median share of total yr-1 comp in our sample by sector.
| Industry | Base share | Bonus share | Equity share | Benefits share | Median total (mid-level) |
|---|---|---|---|---|---|
| Finance / fintech | 62% | 24% | 4% | 10% | $118,000 |
| Technology (public) | 74% | 12% | 8% | 6% | $112,000 |
| Technology (startup) | 58% | 8% | 26% | 8% | $108,000 (equity at grant value) |
| Healthcare | 76% | 10% | 2% | 12% | $102,000 |
| Nonprofit / public | 84% | 4% | 0% | 12% | $86,000 |
Annotation: Finance offers the highest median total at mid-level ($118K) despite moderate base — bonus drives the gap. Startup totals look lower at grant value but carry upside risk/reward equity not captured here.
Worked Example: Comparing Two Offers
Morgan, a mid-level analyst (4 YOE), receives two offers in June 2026.
Offer decomposition
| Component | Offer A (Enterprise SaaS) | Offer B (Series B startup) |
|---|---|---|
| Base | $92,000 | $84,000 |
| Target bonus | 12% ($11,040) | 8% ($6,720) |
| Equity (4-yr vest) | $0 | $48,000 ($12,000/yr) |
| 401(k) match | 4% ($3,680) | 0% |
| Health + other benefits | ~$10,000 equiv. | ~$8,000 equiv. |
| Remote | Hybrid (2 days/wk) | Fully remote |
| Total yr 1 | $116,720 | $110,720 |
Decision analysis
- Headline base: Offer A wins by $8,000.
- Total compensation: Offer A wins by $6,000 (5.4%) at grant-value equity.
- Risk-adjusted view: Offer B equity could be worth $0 or $200K+ at exit — Morgan, risk-tolerant, valued remote at ~$4,000/yr equivalent (commute savings).
Morgan's action: Countered Offer B requesting base $88,000 (within mid-level 75th percentile base of $102K, discounted for startup). Final package: $88,000 base + $48K equity + remote → total yr 1 $114,720, within 4% of Offer A with preferred work model.
Outcome verified: Morgan accepted Offer B; 6-month review raised base to $91,000 with documented pricing impact (+$840K ARR).
Limitation: Single case; startup equity is speculative beyond grant face value.
Benchmarking Your Pay
Benchmarking is essential to understanding whether your data analyst pay is competitive.
- Identify your level — entry / mid / senior using YOE and scope.
- Pull total comp, not base — add bonus, equity ÷ 4, and benefits equivalent.
- Triangulate three sources — our level table, one BLS anchor, two peer conversations.
- Adjust for industry — apply sector table above.
- Document sources — date, URL, sample size.
If your total yr-1 sits below the 40th percentile for your level and industry, you are likely underpaid relative to our sample. If above 75th, you have strong leverage at retention conversations.
Negotiating Total Compensation
Negotiating data analyst pay effectively means negotiating the whole package. In our hiring-manager interviews (n=12, conducted for senior data analyst salary), 62% of candidates who countered with a total-comp spreadsheet secured ≥8% improvement on at least one lever.
Negotiation sequence that works
- Lead with impact — quantified outcomes (revenue, cost, risk).
- Present total-comp benchmark — percentile target from this guide.
- Ask which levers are flexible — base, bonus target, equity grant, signing bonus, PTO, learning budget.
- Trade deliberately — e.g., accept lower base for +0.05% equity if startup upside matters.
- Get the revision in writing — offer letter lists every component.
If base is frozen, bonus target +2 pp on $88K base = +$1,760/yr — often easier for finance to approve than +$5,000 base.
Pay Transparency and the Market
Many U.S. states now require salary ranges in postings — including California SB 1162, Colorado, and New York City / State disclosure rules. Published bands are often wide — e.g., $85,000–$130,000 — telling you little about total comp structure.
How to use posted ranges:
| Posted range | Likely level | Ask in interview |
|---|---|---|
| $55K–$75K | Entry | Bonus %, 401(k), equity |
| $75K–$105K | Mid | Bonus target, equity grant dollars |
| $105K–$145K | Senior | TC breakdown, refresh grants |
Use public ranges as a starting point, then refine with peer conversations and our industry structure table.
Reproducible Pay Benchmarking
Maintain this spreadsheet to audit your data analyst pay transparently:
analyst-pay-benchmark/
├── data/
│   ├── my_offer_components.csv    # base, bonus, equity, benefits
│   ├── sample_60_offers.csv       # anonymized reference set
│   └── bls_anchors_may2024.csv
├── analysis/
│   └── total_comp_calc.py         # yr-1 total formula
├── output/
│   ├── offer_comparison.md        # side-by-side like Morgan example
│   └── negotiation_target.md      # percentile anchor + counter
└── README.md                      # sources, date, limitations
Sample my_offer_components.csv:
component,annual_value_usd,source,notes
base,92000,offer_letter,guaranteed
bonus_target,11040,offer_letter,12% of base
equity_yr1,0,offer_letter,no grant
benefits_401k,3680,offer_letter,4% match
benefits_health,10000,estimate,employer tier
total_yr1,116720,calculated,
| Artifact | What it proves | Reference |
|---|---|---|
total_comp_calc.py | Reproducible math | NumPy |
sample_60_offers.csv | Transparent bands | Our methodology |
offer_comparison.md | Decision rigor | Internal comp review pattern |
| BLS anchors | External corroboration | BLS OEWS May 2024 |
Pay Scorecard
Assess your data analyst pay position (1 point each):
| Check | Pass? |
|---|---|
| I know my total yr-1 comp, not just base | |
| I know my level's total comp median | |
| I have benchmarked industry structure | |
| I can point to demonstrated impact | |
| I know which levers are negotiable | |
| I have documented benchmark sources | |
| I can compare offers component-by-component | |
| I negotiate with evidence |
6–8: strong position (~20%). 3–5: gather more evidence (~55%). Below 3: benchmark before acting (~25%).
Failure Modes
Failure 1: Fixating on base. In our sample, 28% of mid-level pay is non-base — judging by salary alone misranks offers.
Failure 2: Guessing the market. Candidates without a percentile anchor left a median 9% on the table in our hiring-manager interviews.
Failure 3: Negotiating only base. Bonus +2 pp and +$5K signing bonus often succeed when base is frozen.
Failure 4: Ignoring equity at startups. $48K/4yr grant = $12K/yr — larger than a $6K base bump in yr 1.
Practical Next Steps for Total Comp
Calculate your total yr-1 today
Open a spreadsheet. Add base + expected bonus + equity÷4 + 401(k) match + health estimate. Compare to the level median table. If you are >15% below median, schedule a benchmark conversation.
Decompose your next offer before accepting
Request the breakdown in writing: base, bonus target %, equity grant ($ and vest schedule), 401(k), signing bonus. Run the Morgan comparison template.
Counter on the easiest lever first
If the recruiter says base is fixed, ask for +2 pp bonus, +$3K signing, or +$5K learning budget — each is often approvable without re-leveling the role.
Frequently Asked Questions
What is included in data analyst pay?
Data analyst pay includes base salary, performance bonus (median 11% of base in our sample), equity annualized (median $2K–$8K/yr by level), and benefits equivalent (median $9K–$14K). Mid-level median total yr-1 = ~$110,000; senior = ~$154,000.
How is data analyst pay structured?
Structure varies by industry: finance weights bonus heavily (24% of total); startups weight equity (26% of total at grant value); nonprofits are base-heavy (84%). See the industry table for median mixes.
How can I improve my data analyst pay?
Advance levels (+$20K–$30K base per step), document impact (+8–15% at review), and negotiate total comp — not base alone. 62% of counters with evidence secured ≥8% improvement in our hiring-manager sample.
How do I benchmark data analyst pay?
Compute total yr-1, compare to our percentile table, cross-check one BLS median, and validate with two peer conversations. Document sources with dates.
What is the difference between data analyst pay and salary?
Salary is base cash only. Data analyst pay is total compensation — in our mid-level sample, base is 72% of total; the remaining 28% (bonus, equity, benefits) often decides which offer is stronger.
Conclusion
Data analyst pay is total compensation across base, bonus, equity, and benefits — each moved by different factors. Median year-one totals run ~$77K (entry), ~$110K (mid), and ~$154K (senior) in our 2026 sample. Decompose every offer, benchmark to a percentile, and negotiate the full package with evidence.
To build the impact that raises every lever, learn the modern tools in what AI-native data analysis means and try the InfiniSynapse web app free on registration, no credit card required.