Microsoft Excel Data Analysis Tool in 2026
By the InfiniSynapse Data Team · Last updated: 2026-07-09 · We build an AI-native data analysis platform and see how teams use Excel every day; this guide reflects hands-on reality, not a feature list.
Table of Contents
- TL;DR
- How We Evaluated
- Why the Grid Still Wins for Quick Work
- What the Microsoft Excel Data Analysis Tool Does Well
- Core Features Worth Mastering
- The Real Ceiling
- Excel vs Google Sheets vs Power BI vs Python
- Habits That Keep Workbooks Trustworthy
- Selection Scorecard
- Practical Next Steps
- Frequently Asked Questions
- Conclusion
TL;DR
Direct answer: the microsoft excel data analysis tool is the most widely deployed analysis software on earth, excellent for ad-hoc math, pivots, and charts on datasets up to a few hundred thousand rows. Its ceiling is scale, multi-source joins, and recurring automation, which is where governed warehouses, BI platforms, or AI-native agents take over.
Who this is for: anyone using or evaluating the microsoft excel data analysis tool for real work in 2026.
What you'll learn: how we evaluated Excel, what it does well, core features to master, its real limits, how it compares to alternatives, and when to hand off heavier work.
This guide sits within the data analysis tools hub; for the broader workflow, see Excel data analysis: complete how-to. For related depth in this pillar, see Microsoft Office Excel Data Analysis: 2026 Walkthrough and Microsoft Excel Data Analysis: Advanced Techniques.
How We Evaluated
We assessed microsoft excel data analysis tool capabilities against criteria that mirror what teams actually need in 2026: ad-hoc speed, formula transparency, data scale, multi-source joins, statistical depth, and recurring automation. Each capability was checked against Microsoft Learn Excel training paths and Excel support documentation, the analytical workflow described in the Wikipedia data analysis overview, enterprise adoption patterns in IBM's augmented analytics overview, and how quickly agent-assisted analysis matured per the Stanford HAI AI Index. We favor guidance grounded in official product docs and reproducible workflows rather than feature-list marketing.
How We Evaluated: In Practice
Collaboration model, auditability, and handoff signals matter too. A spreadsheet that answers today's question but cannot repeat next month's report without manual rework delivers less long-term value than a governed pipeline. We also tested where the microsoft excel data analysis tool still wins against Google Sheets, Power BI, and scripted Python analysis on the same retail-style datasets teams use weekly.## Why the Grid Still Wins for Quick Work The microsoft excel data analysis tool endures because it is everywhere, everyone has seen it, and it demands almost no specialized training to start. A newcomer can open a sheet, type numbers, and produce a chart within minutes, and that near-zero barrier keeps Excel at the center of business analysis even as more powerful options appear. Familiarity is a genuine feature: a tool the whole organization already understands has no adoption cost, which matters more than marginal feature gains on paper.
Why The Grid Still: What To Verify
Beyond familiarity, the microsoft excel data analysis tool is remarkably flexible for small, self-contained problems. It combines a calculation engine, a charting library, and a lightweight table store in one grid, so a single person can go from raw numbers to a finished summary without touching another application. For the enormous category of quick, one-off questions on modest data, this all-in-one convenience is exactly what people need. Microsoft's Excel documentation catalogs the breadth of what the grid can do, from conditional formatting to scenario tools.
Why The Grid Still: In Practice
Teams we work with still reach for the microsoft excel data analysis tool first when a stakeholder asks a question in a meeting and needs an answer before the call ends. That speed-to-insight is difficult to replicate with platforms that require modeling, deployment, or engineering time. The discipline still follows the process described in the Wikipedia overview of data analysis: define the question, inspect the data, transform it, and communicate findings. Excel simply compresses those stages into a single familiar surface.## What the Microsoft Excel Data Analysis Tool Does Well
The microsoft excel data analysis tool shines at ad-hoc analysis on small-to-medium data. When someone needs to sort a few thousand rows, filter to a segment, compute a total, and chart the result, Excel does it faster than almost anything else because there is no setup, no connection to configure, and no query to write. This immediacy is its defining strength, and it is why analysts reach for it even when heavier tools are available.
It also excels at communication for small audiences. A well-built workbook with clear formulas and a chart is a self-contained artifact anyone can open and inspect, which makes it a natural medium for sharing quick analysis by email. The transparency of the grid—where every number traces to a visible formula—is a real advantage for trust, since a reader can click any cell and see exactly how it was derived. For everyday analytical questions, the microsoft excel data analysis tool remains hard to beat; dismissing it as outdated misreads how much real work still happens in a spreadsheet.
Pivot tables deserve special mention. They turn a long table into a summarized cross-tabulation in seconds and cover a large share of routine aggregation work. Combined with functions such as SUMIFS, XLOOKUP, and dynamic-array spill ranges documented in Microsoft Learn Excel modules, the microsoft excel data analysis tool handles far more than casual users realize.
Core Features Worth Mastering
To get the most from the microsoft excel data analysis tool, a few features repay the effort of learning them. Pivot tables are the single highest-ROI skill: they answer "how much by category" and "how did this change over time" without writing custom formulas. Anyone serious about spreadsheet analysis should master pivots before anything else.
Beyond pivots, formulas such as SUMIFS, INDEX/MATCH or XLOOKUP, and dynamic-array functions unlock flexible calculations without manual repetition, while conditional formatting surfaces patterns visually. Power Query—built into modern Excel—handles repeatable imports and light shaping that used to require copy-paste gymnastics. The Analysis ToolPak adds statistical procedures for those who need them; we cover that add-in in the Excel Data Analysis ToolPak guide.
Learning this handful of features transforms the microsoft excel data analysis tool from a glorified calculator into a capable analysis environment. It is a better use of time for most business users than jumping straight to a programming language they may rarely need. IBM's augmented analytics overview notes that augmented workflows still leave room for human judgment in spreadsheets even as automation expands upstream.
The Real Ceiling
Every strength of the microsoft excel data analysis tool has a matching limit, and knowing where the ceiling sits prevents painful surprises. The first limit is scale: Excel slows and eventually stalls somewhere past a few hundred thousand rows, and it was never built for the millions of rows a modern warehouse holds. Pushing large data through a spreadsheet produces sluggish files and, worse, silent errors when formulas fail to fill an entire range.
The second limit is multi-source work. Joining data from several databases and files is awkward in Excel, prone to manual copy-paste errors, and hard to reproduce. The third limit is recurring automation: because much Excel analysis is manual, running the same report every week means repeating the same clicks, with no memory of last time. These limits are not flaws to fix but signals that the work has outgrown the microsoft excel data analysis tool and needs a different layer.
Recognizing the signals early saves teams from fragile, sprawling workbooks that eventually break under their own weight. Scripted analysis should follow Python documentation conventions for reproducibility when you cross that boundary. The Stanford HAI AI Index documents how quickly agent-assisted preparation matured for teams that outgrow the grid.
Excel vs Google Sheets vs Power BI vs Python
The honest question is not whether the microsoft excel data analysis tool is "best," but which surface fits the job. Spreadsheets win ad-hoc speed; BI platforms win governed dashboards; Python wins custom statistics and pipelines. The table below compares the four options teams most often weigh alongside Excel.
| Dimension | Excel | Google Sheets | Power BI | Python |
|---|---|---|---|---|
| Best for | Ad-hoc math, pivots, quick charts on modest tables | Lightweight collaboration and shared live sheets | Governed dashboards and recurring executive reporting | Custom statistics, ML, and reproducible pipelines |
| Data scale | Comfortable to ~500K rows; slows beyond | Similar ceiling; cloud row limits vary by plan | Warehouse-backed; millions of rows via models | Unlimited with engineering and compute |
| Collaboration | Desktop-first; co-authoring via OneDrive | Real-time multi-user editing native | Publish-and-consume dashboards for wide audiences | Notebooks and Git for technical teams |
| Statistics | Formulas plus optional Analysis ToolPak add-in | Built-in basics; fewer advanced stats | DAX modeling; not a full stats package | Full ecosystem (pandas, SciPy, statsmodels) |
| Automation | Macros, Power Query, Office Scripts | Apps Script | Scheduled refresh and semantic models | Scripts, schedulers, orchestration tools |
| Learning curve | Lowest; ubiquitous in business | Low; familiar grid metaphor | Moderate; data modeling concepts required | Steep; programming fluency expected |
No row wins every scenario. A five-person startup answering a board question on twelve months of sales may need only the microsoft excel data analysis tool; an enterprise publishing weekly KPIs to three hundred viewers needs Power BI or similar. Python enters when statistical methods, machine learning, or strict reproducibility dominate. Google Sheets fits distributed teams that prioritize live co-editing over desktop Excel features. Our hub on data analysis software places these categories in a wider buyer map.
Habits That Keep Workbooks Trustworthy
The transparency that makes the microsoft excel data analysis tool appealing can also become its weakness when workbooks grow complex. A few disciplines keep Excel reliable as the analysis matures. Separate raw data, calculations, and presentation onto distinct sheets so source data is never overwritten and logic is easy to audit. Analysts who mix inputs and formulas in one crowded sheet eventually lose track of which cell drives which result.
Document assumptions in the workbook itself—a short notes area explaining where the data came from, what each key formula does, and what date range it covers. Because the microsoft excel data analysis tool makes it easy to build quickly, it is equally easy to forget the reasoning a month later. A little documentation turns a disposable sheet into a maintainable asset.
Know when a workbook has outgrown the grid. When a file sprawls across dozens of interlinked sheets, recalculates slowly, or breaks whenever someone edits it, those are signs the analysis belongs in a warehouse-backed or agent-assisted layer. For cleaning workflows that stay in Excel longer, see how to clean Excel data with AI.
Practical example: a regional sales manager receives a monthly CSV export of 18,000 order lines. Using the microsoft excel data analysis tool, she loads the file with Power Query, removes duplicate order IDs, builds a pivot of revenue by product line and region, and adds a column chart for the leadership email. The entire workflow takes forty minutes and requires no IT ticket. When the same manager later needs to blend CRM notes, warehouse inventory, and ad spend from three systems every Monday, that is the handoff point: keep Excel for the final chart if needed, but move joins and refresh to Power BI or an agent layer.
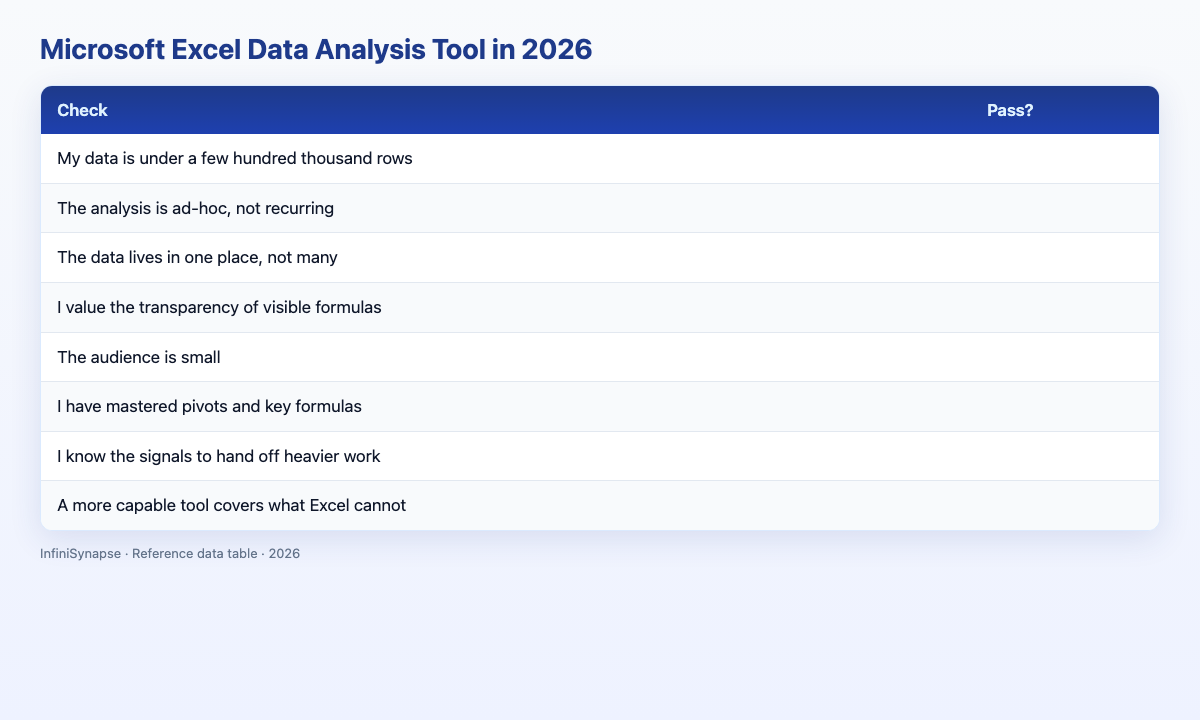
Selection Scorecard
Decide when the microsoft excel data analysis tool fits (1 point each):
| Check | Pass? |
|---|---|
| My data is under a few hundred thousand rows | |
| The analysis is ad-hoc, not recurring | |
| The data lives in one place, not many | |
| I value the transparency of visible formulas | |
| The audience is small | |
| I have mastered pivots and key formulas | |
| I know the signals to hand off heavier work | |
| A more capable tool covers what Excel cannot |
6–8: Excel is the right choice. 3–5: fine with a handoff plan. Below 3: start with warehouse, BI, or agent tooling.
Practical Next Steps
Verify against real job postings
Before committing time or budget, pull five recent job postings in your target market and list the SQL, visualization, and communication skills each repeats. Align your learning plan to those patterns rather than a generic syllabus.
Ship one portfolio artifact this month
Employers hire on demonstrated ability. Publish one finished analysis — with a clear question, reproducible queries, and a short executive summary — alongside any credential or course completion.
Frequently Asked Questions
Is Microsoft Excel a good data analysis tool?
Yes. The microsoft excel data analysis tool is excellent for ad-hoc analysis on small-to-medium data—sorting, filtering, pivots, formulas, and charts on up to a few hundred thousand rows. Its limits are scale, multi-source joins, and recurring automation, where governed analytics or an AI-native agent takes over.
What is Excel best for in data analysis?
The microsoft excel data analysis tool is best for quick, one-off questions on modest data: pivot tables, formula-driven calculations, and charts that anyone can open and inspect. Its transparency and near-zero learning curve make it the reflexive first choice for everyday analytical tasks.
What are the limits of the Microsoft Excel data analysis tool?
The main limits are scale (it stalls past a few hundred thousand rows), multi-source joins (awkward and error-prone), and recurring automation (mostly manual with no memory). These signal when work has outgrown Excel and needs a database-backed or agent-assisted tool.
When should I stop using Excel for analysis?
Hand off from the microsoft excel data analysis tool when data volume exceeds what it handles comfortably, when analysis must join several sources, or when the same report repeats on a schedule. Keep Excel for quick views, and move heavy, recurring, multi-source work elsewhere.
How does Excel compare to Google Sheets for analysis?
Both are strong for ad-hoc spreadsheet work. The microsoft excel data analysis tool leads on desktop power features—Power Query depth, Analysis ToolPak, and advanced modeling—while Google Sheets leads on real-time multi-user editing. Choose based on collaboration model and feature depth, not brand alone.
Conclusion
The microsoft excel data analysis tool remains indispensable for ad-hoc analysis on modest data, and its transparency and familiarity keep it at the center of business work. Master pivots, Power Query, and key formulas, respect its ceiling, and hand off scale, multi-source joins, and recurring work to governed BI or agent-assisted layers when the signals appear.
Teams that treat the microsoft excel data analysis tool as one layer in a stack—not the entire data platform—report fewer month-end fires and faster promotions to Power BI when dashboards need a wider audience.
To practice the AI-era skills employers want, read what AI-native data analysis means and try the InfiniSynapse web app free on registration, no credit card required.