Using Excel for Data Analysis: Pros, Limits, and When to Graduate
By the InfiniSynapse Data Team · Last updated: 2026-07-09 · We build an AI-native data analysis platform and see where teams thrive and struggle with spreadsheets; this guide reflects that hands-on perspective, not a sales angle.
Table of Contents
- TL;DR
- How We Evaluated
- When Excel Is Genuinely Enough
- The Honest Pros
- The Honest Limits
- Excel vs Google Sheets vs Power BI vs Python
- Signals It Is Time to Graduate
- What to Graduate To
- Selection Scorecard
- Practical Next Steps
- Frequently Asked Questions
- Conclusion
TL;DR
Direct answer: using excel for data analysis is the right choice for ad-hoc questions on modest, single-source data, and a poor choice for large, multi-source, or recurring production work. The skill is knowing which situation you are in and graduating to a more capable tool at the right moment rather than too late.
Who this is for: managers and analysts deciding whether excel for data analysis still fits their next project.
What you'll learn: how we evaluated the decision, honest pros and limits, comparisons to alternatives, graduation signals, and sensible next tools.
This guide sits within the data analysis tools hub; for technique depth, see Excel data analysis: complete how-to. For related depth, see Excel as a data analysis tool and Microsoft Excel Data Analysis: Advanced Techniques.
How We Evaluated
We assessed using excel for data analysis against real team outcomes in 2026—not feature checklists. We scored ad-hoc speed, formula transparency, collaboration friction, scale limits, multi-source pain, and repeatability on monthly operational tasks. Evidence came from Microsoft Learn Excel training paths, Excel support documentation, the Wikipedia data analysis overview, IBM's augmented analytics overview, and the Stanford HAI AI Index.
How We Evaluated: Common Pitfalls
We ran parallel exercises using excel for data analysis versus Google Sheets, Power BI, and Python on the same stakeholder questions to see where the spreadsheet still won and where it became a tax.
How We Evaluated: What To Verify
The evaluation favors honest fit over ideology. Plenty of valuable decisions still originate in Excel; the mistake is forcing every problem to stay there.
How We Evaluated: In Practice
Interview stakeholders about how they consume numbers. If they only read PDF snapshots and never open live workbooks, you may be maintaining interactive models for an audience that does not use them—a hint that static BI or email reports could replace fragile tabs.## When Excel Is Genuinely Enough
Excel for data analysis is enough when the data is modest, the question is ad-hoc, the audience is small, and inspectable formulas matter more than automated scale. Examples: a product lead exploring pricing scenarios before a meeting; a recruiter comparing pipeline counts by source for a weekly email; a founder stress-testing runway assumptions with three input cells.
It is also enough when time-to-answer beats infrastructure. Standing up a warehouse model for a one-time board question wastes calendar. Using excel for data analysis for the first pass—and documenting assumptions—is often the rational choice if everyone knows the artifact is exploratory.
Finally, Excel remains enough when stakeholders negotiate in the grid. Some decisions are made by changing a yellow input cell together. Removing Excel prematurely can slow alignment even if a "better" tool exists on paper.
The Honest Pros
The first pro of excel for data analysis is speed. Import, filter, pivot, chart—minutes, not sprint points. The second is transparency: click a cell, see the formula, trace precedents. The third is ubiquity: no procurement cycle, no training queue.
Fourth, Excel combines calculation, light storage, and charting without context switching. Fifth, Power Query added repeatable refresh so excel for data analysis is not purely manual copy-paste anymore. Microsoft's Excel documentation reflects how much desktop power improved in the last decade.
Sixth, Excel exports everywhere—PDF, slides, email attachments—so the last mile of communication stays simple. For small-team alignment, those pros outweigh missing features you do not yet need.
Seventh, familiarity reduces training cost. New hires often arrive with baseline spreadsheet literacy, so excel for data analysis projects start faster than notebook or BI rollouts that require weeks of enablement. That advantage compounds in high-churn teams where onboarding speed matters.
The Honest Limits
The limits of excel for data analysis are predictable. Scale: performance collapses as rows approach seven figures. Multi-source joins: fragile VLOOKUP chains and manual merges invite silent errors. Governance: row-level security and audit trails are not spreadsheet strengths.
Repetition: monthly rebuilds consume analyst hours that scripted pipelines would save. Collaboration at scale: co-authoring helps, but fifty executives refreshing different filter states is a BI problem, not a grid problem. Statistical depth: the ToolPak helps, but production inference belongs in code; see Excel Data Analysis ToolPak.
IBM's augmented analytics overview tracks how enterprises layer governed analytics over self-serve spreadsheets—acknowledging Excel's role without pretending it is a warehouse.
Repetition without automation is the hidden tax. Track how many hours your team spends rebuilding the same tabs each month. When that number exceeds the time to prototype a Power Query or BI replacement, the business case for graduation writes itself—even if the grid still feels comfortable.
Excel vs Google Sheets vs Power BI vs Python
Choosing excel for data analysis is choosing one row in a four-way comparison. Use the table before defaulting to habit.
| Dimension | Excel | Google Sheets | Power BI | Python |
|---|---|---|---|---|
| Best for | Ad-hoc math, pivots, quick charts on modest tables | Lightweight collaboration and shared live sheets | Governed dashboards and recurring executive reporting | Custom statistics, ML, and reproducible pipelines |
| Data scale | Comfortable to ~500K rows; slows beyond | Similar ceiling; cloud row limits vary by plan | Warehouse-backed; millions of rows via models | Unlimited with engineering and compute |
| Collaboration | Desktop-first; co-authoring via OneDrive | Real-time multi-user editing native | Publish-and-consume dashboards for wide audiences | Notebooks and Git for technical teams |
| Statistics | Formulas plus optional Analysis ToolPak add-in | Built-in basics; fewer advanced stats | DAX modeling; not a full stats package | Full ecosystem (pandas, SciPy, statsmodels) |
| Automation | Macros, Power Query, Office Scripts | Apps Script | Scheduled refresh and semantic models | Scripts, schedulers, orchestration tools |
| Learning curve | Lowest; ubiquitous in business | Low; familiar grid metaphor | Moderate; data modeling concepts required | Steep; programming fluency expected |
Excel for data analysis leads when inspectable what-if work and desktop power matter. Google Sheets leads live multi-user editing. Power BI leads recurring dashboards. Python leads custom methods and scale.
Budget for dual-running during migration. Running old and new reports in parallel for one close cycle costs hours upfront but prevents executive surprise when totals shift because definitions—not just tools—changed.
Celebrate small wins when graduating. The first report that refreshes without a manual copy-paste is a milestone worth sharing—it proves the team crossed from hero-dependent spreadsheets to something closer to a durable system.
Signals It Is Time to Graduate
Graduate from excel for data analysis when you see two or more signals together: recalc measured in minutes; files nobody edits except one hero analyst; the same Monday rebuild for months; joins across three-plus systems; executives need governed single versions of truth; regulators ask for reproducible scripts.
Another signal is error cost. When a wrong pivot changes a staffing decision or marketing spend, the spreadsheet layer needs governance upstream. The Stanford HAI AI Index documents how agent-assisted preparation reduced manual glue work for teams that crossed these thresholds.
Involve finance or data governance early when graduation affects headcount or budget reports. Tool migrations fail politically when numbers shift without a reconciled mapping document explaining every definitional change between old and new systems.
Graduation is not shame—it is scope management. Keep excel for data analysis as the negotiation layer if helpful; move system-of-record metrics elsewhere.
Practical example: a customer success team tracks health scores in Excel for eighteen accounts—fine. When they expand to 4,000 accounts with product usage from Redshift, billing from Stripe, and tickets from Zendesk, refreshed daily, excel for data analysis becomes a bottleneck. They graduate ETL and dashboards to Power BI, keep Excel for account planning what-ifs on exported subsets.
What to Graduate To
Match the bottleneck to the tool. If the pain is sharing recurring dashboards, graduate to Power BI. If the pain is custom statistics or ML, graduate to Python. If the pain is live co-editing with external partners, consider Google Sheets for a slice of work while keeping Excel for heavy models.
If the pain is multi-source refresh with human review, add a warehouse query layer or agent-assisted preparation before visualization. Our guide to what AI-native data analysis means explains that pattern without replacing Excel wholesale.
Document metric definitions during migration. Graduation fails when Power BI numbers disagree with the old Excel file and nobody knows why.
Schedule a quarterly review of any recurring excel for data analysis workbook. Ask whether rebuild time grew, whether sources multiplied, and whether executives still trust the numbers without a walkthrough. Those three questions surface graduation timing earlier than crisis-driven platform swaps.
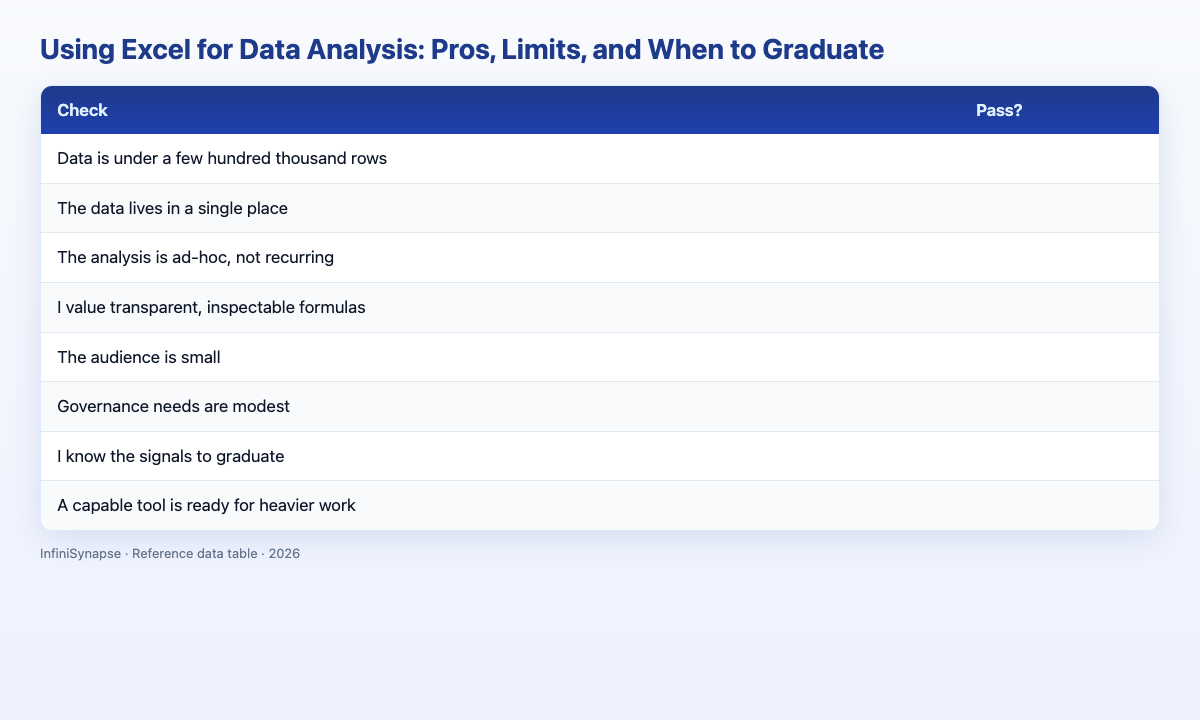
Selection Scorecard
Should you use excel for data analysis for this project? (1 point each)
| Check | Pass? |
|---|---|
| Row counts fit comfortably in Excel | |
| Sources are few and refresh is simple | |
| The audience is small or accepts workbook links | |
| The question is exploratory or monthly | |
| Formula transparency is a feature, not a risk | |
| Error cost is low if a version is wrong | |
| I can refresh without a half-day rebuild | |
| I have a graduation plan if scope doubles |
6–8: excel for data analysis is a strong fit. 3–5: use Excel with explicit caveats and timeline. Below 3: start in BI or code; export views to Excel if needed.
Run a simple time study on your last three recurring reports. If rebuild time grew quarter over quarter while row counts stayed flat, the bottleneck is process—not data size—and graduation may help even before you hit hard scale limits.
Practical Next Steps
Verify against real job postings
Before committing time or budget, pull five recent job postings in your target market and list the SQL, visualization, and communication skills each repeats. Align your learning plan to those patterns rather than a generic syllabus.
Frequently Asked Questions
Is Excel good for data analysis?
Yes—for modest, ad-hoc, inspectable work. Using excel for data analysis is a poor primary choice for warehouse-scale, multi-source, or heavily regulated production pipelines.
What are the main pros of Excel for data analysis?
Speed, transparency, ubiquity, and integrated charting. Excel for data analysis also benefits from Power Query refresh on many recurring imports.
What are the main limits?
Scale, fragile multi-source joins, weak governance, and manual repetition. Those limits define when excel for data analysis should graduate to BI or code.
When should I stop using Excel for data analysis?
When performance, rebuild time, source count, or audience size create recurring pain—or when errors become expensive. Graduate while keeping Excel for what-if sandboxes if stakeholders need them.
What should I learn after Excel?
Learn Power BI for dashboards, SQL for warehouse queries, and Python for custom methods. Excel for data analysis skills still transfer—pivot thinking maps to group-by logic in code.
Create a graduation playbook before you need it: name the target tool, the first metric to migrate, the reconciliation owner, and the week you will dual-run old and new reports. Teams that wait for a crisis migrate under pressure and skip validation.
Conclusion
Using excel for data analysis remains rational for fast, modest, transparent work—and irrational when scale, sources, or repetition turn the grid into a bottleneck. Name your situation honestly, graduate when two or more signals appear, and keep Excel where negotiation and inspectability still help.
Share graduation stories internally. When one team documents how they moved a weekly rebuild from twelve hours to a scheduled refresh, peers recognize their own pain faster than generic vendor slides—and adoption of the next tool accelerates without a mandate from the top.
To practice the AI-era skills employers want, read what AI-native data analysis means and try the InfiniSynapse web app free on registration, no credit card required.