Exploratory Data Analysis (EDA): A 2026 Guide
By the InfiniSynapse Data Team · Last updated: 2026-07-09 · We profile datasets in production daily; this EDA guide reflects how exploration actually works—from first look to hypotheses worth testing.

Table of Contents
- TL;DR
- How We Evaluated EDA Practice
- What EDA Is and Why Tukey Matters
- Why Exploration Comes First
- Core Techniques and Visual Views
- A Step-by-Step Exploration Sequence
- What to Look For During Profiling
- Exploratory Versus Confirmatory Work
- Common Mistakes That Undermine EDA
- How AI Automates Initial Profiling
- From Exploration to Action
- EDA Practice Scorecard
- Frequently Asked Questions
- Conclusion
TL;DR
Direct answer: exploratory data analysis (EDA) is the practice of examining a dataset to understand its structure, spot patterns, catch problems, and form hypotheses before any formal modeling. It relies on summaries and visualizations to let the data reveal what questions are worth asking—and it is the essential first phase of serious analysis.
Who this is for: anyone learning exploratory data analysis or wanting to do it more rigorously in 2026.
What you'll learn: how we evaluated EDA practice, what it is, why it matters, core techniques, a step-by-step sequence, how it differs from confirmatory work, and how AI accelerates initial profiling.
This guide sits within the data analysis complete guide; for the broader method set, see data analysis methods. For the full six-step sequence exploration fits inside, see data analysis process.
How We Evaluated EDA Practice
We assessed exploratory data analysis using criteria that mirror how experienced analysts judge a first pass before modeling—not how textbooks list chart types. Each technique and step was checked against four dimensions: whether structure and quality are understood before aggregation, whether multiple visual views are used rather than a single chart, whether patterns are treated as hypotheses rather than proof, and whether exploration ends in a written plan for follow-up.
We aligned the discipline with the Wikipedia overview of data analysis, which describes inspection and transformation as foundational stages rather than optional shortcuts. IBM's augmented analytics overview informed how we describe agents that automate profiling while humans supply interpretation. The Stanford HAI AI Index tracks how quickly such hybrid exploration workflows matured in production. For technical baselines we referenced the pandas user guide for tabular profiling and matplotlib documentation for honest visualization defaults.
The table below summarizes the evaluation dimensions we apply when recommending exploratory data analysis as a non-negotiable first phase.
| Evaluation dimension | Why it matters in 2026 | What we tested |
|---|---|---|
| Structure first | Wrong grain invalidates everything | Row counts, dtypes, column meanings documented |
| Quality checks | Dirty data produces confident errors | Missing, duplicate, and outlier patterns flagged |
| Multi-view discipline | One chart hides alternate stories | At least three visual angles per key variable |
| Hypothesis generation | Exploration proposes; confirmation tests | Patterns labeled as ideas, not conclusions |
| Surprise capture | New insight often unanticipated | Unexpected relationships logged explicitly |
| Decision handoff | Exploration must lead somewhere | Written summary of next two or three questions |
| Scale awareness | Profiling methods change with volume | Sample versus full-scan strategy stated |
| Reproducibility | Exploration reruns on fresh data | Profiling steps expressed as rerunnable logic |
What EDA Is and Why Tukey Matters
Exploratory data analysis is the open-ended investigation of a dataset to understand what it contains before committing to any specific analysis or model. Coined by statistician John Tukey, the approach treats the first encounter with data as a chance to listen rather than to impose expectations. You profile columns, visualize distributions, and probe relationships to build an honest mental model of the data.
The spirit of EDA is curiosity without premature conclusions. Rather than testing a fixed hypothesis immediately, you let the data suggest which hypotheses are worth testing, which problems need fixing, and which patterns deserve a closer look. This exploratory stance distinguishes exploratory data analysis from confirmatory analysis, which comes later to formally test the ideas that exploration surfaces. EDA is where understanding begins; skipping it is the most common cause of analysis that is technically correct but practically useless.
Why Exploration Comes First
Exploratory data analysis matters because analysis built on an unexamined dataset is analysis built on sand. Without EDA, you might model data that contains errors, misunderstand what a column actually represents, or miss the pattern that mattered most. The time invested in exploratory data analysis repeatedly saves far more time later by catching problems and pointing the analysis in a productive direction.
Beyond error-catching, exploratory data analysis shapes the questions worth asking. Often the most valuable insight is one you did not anticipate, and only exploration surfaces it. A dataset examined openly reveals surprising relationships, unexpected clusters, and anomalies that a narrow, hypothesis-first approach would overlook. Experienced analysts treat exploratory data analysis as non-negotiable because it is the phase where genuine understanding forms.
Dashboard-centric workflows sit within the broader Wikipedia business intelligence overview, which scales metric visibility—but dashboards rarely replace the investigative first look at a new or messy dataset. EDA answers "what is actually in here?" before any dashboard metric is trusted.
Core Techniques and Visual Views
Exploratory data analysis relies on a toolkit of summaries and visualizations. Summary statistics—means, medians, ranges, standard deviations—give a quick numerical sense of each variable. Frequency counts and distributions reveal how values spread. These simple summaries are the first move in almost any exploratory data analysis.
Visualization is the heart of the practice, because the eye catches patterns tables hide. Histograms show distributions, box plots reveal spread and outliers, scatter plots expose relationships between variables, and correlation matrices summarize many relationships at once. We survey these and more in data analysis techniques. The key principle of exploratory data analysis is to look at the data from many angles, because each visualization answers a different question and no single view tells the whole story.
A Step-by-Step Exploration Sequence
A disciplined exploratory data analysis follows a loose but repeatable sequence. First, understand the structure: how many rows and columns, what each column means, and what data types are present. Second, assess quality: check for missing values, duplicates, and obvious errors, since these shape everything that follows.
Third, examine each variable individually—distributions and summary statistics to understand its behavior. Fourth, examine relationships between variables using scatter plots, cross-tabulations, and correlations. Fifth, form hypotheses about what the data suggests and note questions for deeper analysis. This sequence keeps exploratory data analysis thorough rather than haphazard, though within it exploration remains flexible, following interesting threads as they appear.
Practical example: a retail analyst receives a twelve-month order export with 840,000 rows and eighteen columns. Her exploratory data analysis starts with info()-style profiling: revenue stored as text in 3% of rows, duplicate order lines on a composite key, and a "discount" column that is null for every row before March. Histograms show revenue right-skewed; scatter plots reveal accessories revenue growing faster than electronics despite lower totals. She ends with a one-page summary: fix parsing rules, dedupe on order ID plus line number, and prioritize a category growth analysis for merchandising. That inspectable trail aligns with Harvard Business Review's skills-based hiring research on demonstrated analytical outcomes over credential signals alone.
What to Look For During Profiling
Effective exploratory data analysis means knowing what to look for. Outliers—values far from the rest—may signal errors or the most interesting cases; either way they demand attention. Missing data patterns matter, since data missing systematically rather than randomly can bias every subsequent conclusion. Unexpected distributions, such as a variable clustering at a suspicious value, often reveal data-collection issues.
In exploratory data analysis, you also look for relationships and their absence. A strong correlation might suggest a driver worth investigating, while an expected relationship that fails to appear is equally informative. Clusters and segments within the data can reveal natural groupings worth analyzing separately. Throughout exploration, the goal is honest, detailed understanding—noting both what confirms expectations and, more valuably, what surprises you.
Exploratory Versus Confirmatory Work
Exploration and confirmation serve different purposes. The table below contrasts how exploratory data analysis differs from the confirmatory phase that typically follows.
| Dimension | Exploratory phase | Confirmatory phase |
|---|---|---|
| Primary goal | Understand and generate ideas | Test predefined hypotheses |
| Question shape | Open-ended: "what is here?" | Closed: "is X true at α=0.05?" |
| Methods | Summaries, plots, profiling | Tests, models, confidence intervals |
| Output | Hypotheses and quality flags | Accepted or rejected claims |
| Risk if skipped | Wrong model on dirty data | Premature certainty from one chart |
| Typical timing | First encounter with dataset | After exploration plan is written |
| Human role | Curiosity and pattern recognition | Rigor and statistical discipline |
Exploratory data analysis generates ideas; confirmatory analysis proves or disproves them. Treating an exploratory pattern as proof—rather than a hypothesis—is a common and serious mistake. Enterprise adoption patterns in Google Cloud's AI overview mirror the shift toward workflows that automate exploratory profiling while keeping confirmatory judgment with human analysts.
Common Mistakes That Undermine EDA
Several mistakes undermine exploratory data analysis. The first is skipping it entirely, rushing to model data that was never understood. The second is confirmation bias—exploring only in directions that support a preferred conclusion rather than letting the data speak honestly.
A third mistake is looking at too few views, drawing conclusions from a single chart when another angle would tell a different story. A fourth is mistaking exploration for confirmation, treating a pattern spotted during exploratory data analysis as a proven finding. EDA generates ideas; it does not prove them, and conflating the two leads to overconfident claims. Avoiding these mistakes keeps exploration honest and productive.
How AI Automates Initial Profiling
In 2026, exploratory data analysis is increasingly accelerated by AI-native agents that profile a dataset, generate relevant visualizations, and flag anomalies in moments. Where an analyst once spent hours manually profiling columns and plotting distributions, an agent can perform much of this initial exploratory data analysis and surface what deserves attention.
The agent handles mechanical profiling; the human supplies curiosity and interpretation. IBM's augmented analytics overview describes this division as essential governance—not optional skepticism. Verify agent output the same way you review a colleague's notebook: check row counts after joins, sanity-check totals, and rerun on a held-out slice. The Stanford HAI AI Index documents how quickly that hybrid pattern became standard in production teams.
From Exploration to Action
Exploration is valuable only if it leads somewhere. As patterns, problems, and questions surface, a disciplined analyst records them and decides which deserve follow-up. Some findings will be data-quality issues to fix before any analysis proceeds; others will be promising hypotheses worth testing formally; still others will be surprises that reframe the original question entirely.
The transition from exploration to action is where judgment matters most. Not every pattern warrants pursuit, and part of the skill is distinguishing signal that changes a decision from noise that merely looks interesting. A practical habit is to end exploratory data analysis with a short written summary: what the data contains, what problems it has, and which two or three questions are now worth serious analysis. This summary turns an open-ended investigation into a focused plan, ensuring that understanding built during exploration is actually put to use.
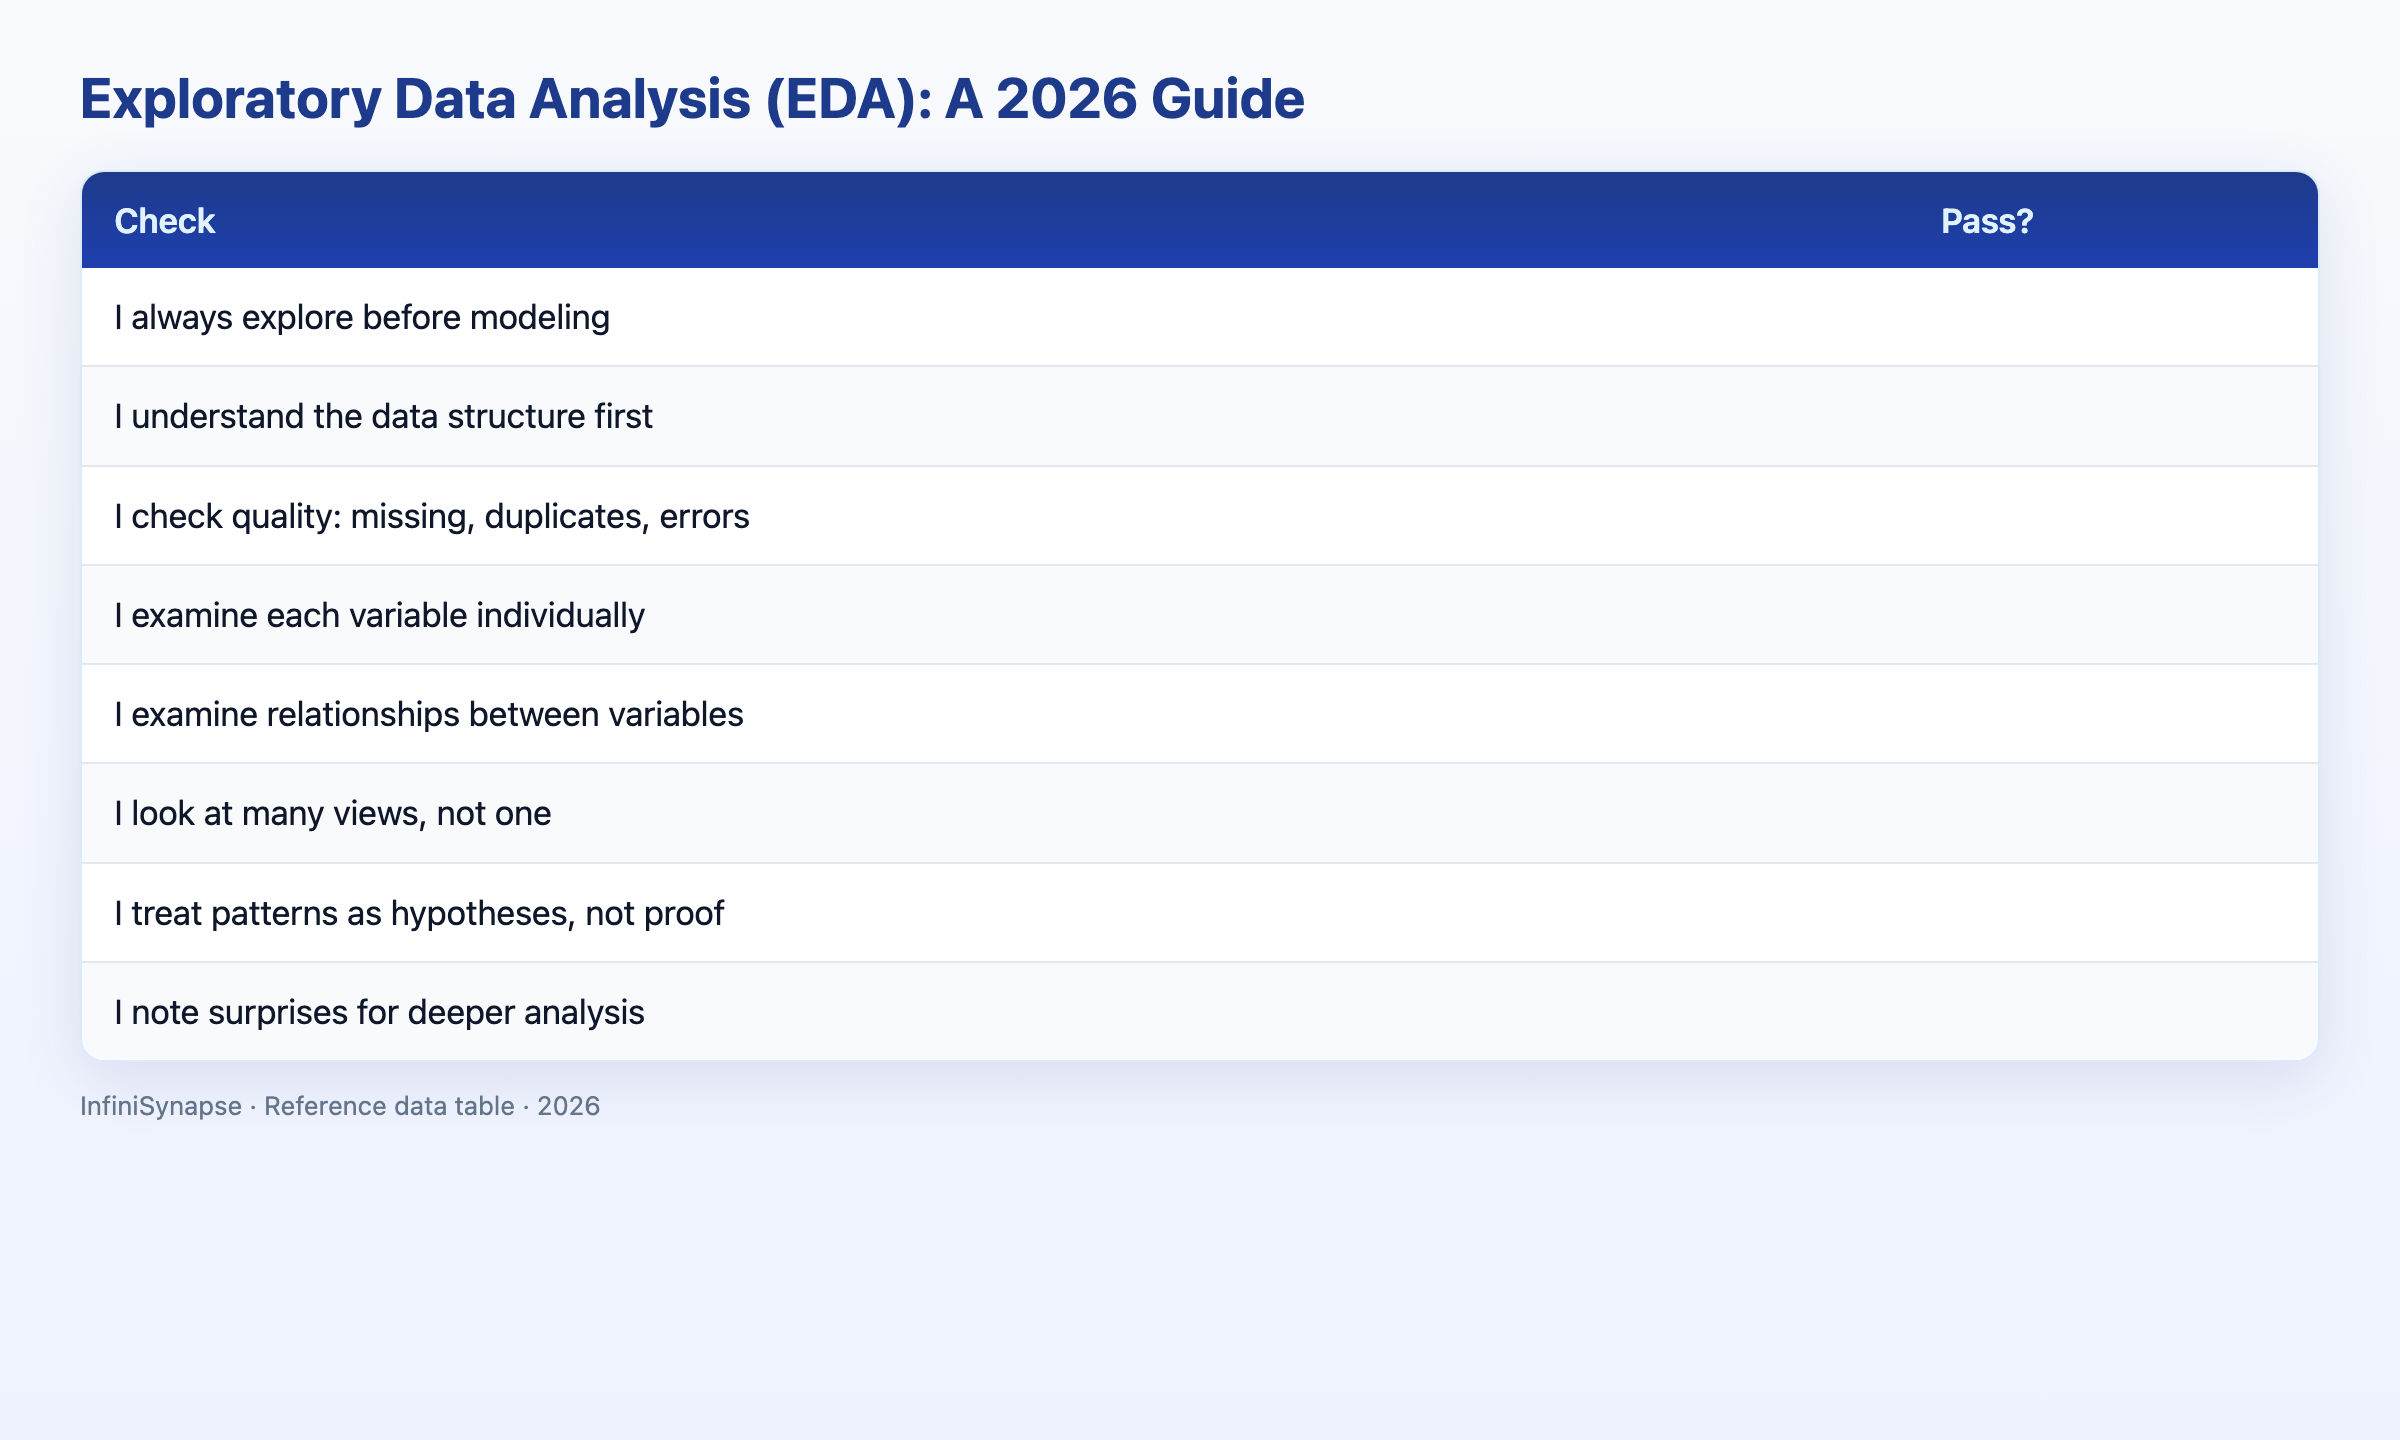
EDA Practice Scorecard
Assess your EDA practice (1 point each):
| Check | Pass? |
|---|---|
| I always explore before modeling | |
| I understand data structure first | |
| I check quality: missing, duplicates, errors | |
| I examine each variable individually | |
| I examine relationships between variables | |
| I look at many views, not one | |
| I treat patterns as hypotheses, not proof | |
| I end with a written follow-up plan |
6–8: strong EDA practice. 3–5: reinforce one step from the sequence above. Below 3: make exploration a mandatory first phase.
Frequently Asked Questions
What is EDA in simple terms?
EDA is the practice of examining a dataset to understand its structure, spot patterns, catch problems, and form hypotheses before formal modeling. Coined by John Tukey, it uses summaries and visualizations to let the data reveal what questions are worth asking.
Why should exploration come before modeling?
Analysis built on an unexamined dataset is unreliable. EDA catches errors, clarifies what each variable means, and surfaces unexpected patterns that a hypothesis-first approach would miss. Time invested in exploration repeatedly saves more later.
Which techniques are most used?
Summary statistics, frequency distributions, and visualizations: histograms for distributions, box plots for spread and outliers, scatter plots for relationships, and correlation matrices for many pairwise views. The principle is to view data from many angles.
How does exploration differ from confirmation?
Exploration openly investigates data to surface patterns and generate hypotheses. Confirmatory analysis comes later to formally test those hypotheses. Exploration generates ideas; confirmation proves or disproves them.
Can AI help with the first pass?
Yes. Agents can profile a dataset, generate relevant visualizations, and flag anomalies in moments, surfacing what deserves human attention. The human still interprets patterns and decides which hypotheses merit formal testing.
Conclusion
Exploratory data analysis is the essential first phase where you examine a dataset openly to understand it, catch problems, and form hypotheses before formal modeling. It relies on summaries and many visualizations, rewards genuine curiosity over confirmation bias, and in 2026 is accelerated by agents that profile data while humans interpret.
To see automated exploration alongside rigorous follow-up, read the complete data analysis guide and what AI-native data analysis means, then try the InfiniSynapse web app free on registration.