Financial Data Analysis: Techniques and Tools (2026)
By the InfiniSynapse Data Team · Last updated: 2026-07-10 · We build an AI-native data analysis platform and evaluate financial analytics against GAAP/IFRS definitions, Basel credit standards, and audit-ready documentation — this guide includes precise formulas, a worked credit review with sample outputs, and reproducible analysis artifacts.
Table of Contents
- TL;DR
- How We Evaluated Financial Techniques
- What Distinguishes Finance From General Analysis
- Core Techniques Explained
- Key Metrics and Ratio Definitions
- Tools Compared
- Common Applications
- Worked Example: MidStates Manufacturing Credit Review
- The Rigor Finance Demands
- Reproducible Financial Analysis Artifacts
- AI and Financial Analysis in 2026
- Financial Analysis Scorecard
- Practical Next Steps for Finance Analysts
- Frequently Asked Questions
- Conclusion
TL;DR
Direct answer: financial data analysis examines revenues, costs, cash flows, and market data to inform performance, risk, and investment decisions through techniques like ratio analysis, trend comparison, and forecasting — under audit and regulatory standards aligned with FASB ASC, IFRS Standards, Basel III capital frameworks, and CFA Institute financial analysis guidance. Errors carry direct monetary consequences, so validation, documentation, and defensible methods are non-negotiable.
Who this is for: analysts, finance professionals, and business leaders applying financial data analysis to decisions with monetary or compliance stakes.
What you'll learn: how we evaluated financial techniques against regulatory standards, precise ratio definitions, tool comparisons, a worked credit review with eight-quarter outputs, reproducible artifacts, rigor requirements, and how AI-native workflows fit.
This guide sits within the advanced methods hub. For forecasting depth, see predictive data analysis. For public-filing workflows, see secondary data analysis.
How We Evaluated Financial Techniques
We selected financial data analysis techniques for this guide using criteria that mirror how finance teams and investment professionals actually work in 2026 — not spreadsheet aesthetics alone. Each method was checked against four dimensions: whether inputs reconcile to authoritative sources (general ledger, SEC EDGAR filings, market data vendors), whether calculations follow recognized definitions investors and auditors expect, whether outputs tie to a specific decision with documented assumptions, and whether the workflow leaves an audit trail reproducible months later.
We anchored evaluation to primary regulatory and professional sources rather than general web summaries:
| Standard | What it governs | Authoritative source |
|---|---|---|
| US GAAP | Revenue, leases, recognition | FASB ASC — e.g., ASC 606 revenue, ASC 842 leases |
| IFRS | Global financial reporting | IFRS Foundation standards — e.g., IFRS 15, IFRS 16 |
| SEC disclosure | US public company filings | Regulation S-X |
| Credit risk | Bank capital and lending | Basel Committee framework |
| Professional practice | Analyst ethics and methods | CFA Institute Code and Standards |
Financial data analysis inherits those expectations: a ratio computed from the wrong line item or period alignment is worse than no ratio at all. For occupational context we referenced the Bureau of Labor Statistics financial analyst profile.
Regulatory context shapes method choice. Public company work references SEC EDGAR filings; lending teams follow internal credit policies and Basel III risk-weighted asset frameworks. We favor transparent tools — spreadsheets with traceable formulas, SQL pipelines with logged transforms, Python notebooks with pinned versions — over black boxes when conclusions affect capital allocation. IBM's augmented analytics overview describes governed enterprise analytics; the Stanford HAI AI Index tracks AI adoption in financial services while noting persistent demand for auditable, explainable outputs in regulated workflows.
| Evaluation dimension | What good looks like | Common failure |
|---|---|---|
| Source | GL / 10-K line items cited | Hard-coded totals with no trail |
| Definition | Formula matches ASC / CFA convention | EBITDA variants mixed without bridge |
| Period | Fiscal periods aligned consistently | Calendar vs fiscal mismatch |
| Decision | Output tied to approve / decline / price | Dashboard with no action |
| Stress | Base + downside scenarios documented | Single-point forecast only |
| Audit | Versioned model + assumption log | Email attachment with no history |
| YMYL | Limitations stated for external readers | Overclaiming from one quarter |
| Reproduce | SQL or formula file reruns metrics | Black-box score with no steps |
What Distinguishes Finance From General Analysis
Financial data analysis shares methods with general analytics — aggregation, visualization, modeling — but operates under higher stakes and stricter conventions. Numbers map to accounting identities that must balance; periods must align (fiscal versus calendar); definitions like EBITDA or free cash flow must match stakeholder expectations or be explicitly adjusted with bridges per FASB Conceptual Framework.
Decisions carry immediate monetary impact: mispriced credit, wrong acquisition bid, flawed budget allocation. Regulatory and audit scrutiny follow. That environment favors conservative assumptions, sensitivity tables, and documentation a reviewer can follow without interviewing the analyst.
Domain literacy matters. Understanding how ASC 606 revenue recognition, working capital, and non-GAAP adjustments flow through statements prevents elegant models built on incoherent inputs. Financial data analysis is applied analysis — the domain is not optional context.
Core Techniques Explained
Professional financial data analysis combines complementary techniques. Ratio analysis compresses statement relationships — profitability, liquidity, leverage, efficiency — into comparable metrics across companies and periods. Trend analysis tracks those metrics over time to reveal momentum, seasonality, and inflection points. Comparative analysis benchmarks against peers, industry medians, or management guidance.
Variance analysis compares actuals to budget or forecast, decomposing differences into volume, price, and mix drivers. Forecasting projects income, cash flow, or balance-sheet items — covered in depth in predictive data analysis — with scenarios and sensitivity. Valuation techniques (discounted cash flow, multiples) integrate these inputs into investment conclusions.
The table below maps techniques to decisions. Use it before building yet another dashboard tab.
| Technique | Question it answers | Typical inputs | Typical output |
|---|---|---|---|
| Ratio analysis | Is the firm profitable, liquid, levered? | Income statement, balance sheet | Margin, current ratio, D/E |
| Trend analysis | How are metrics evolving? | Multi-period statements | Time-series charts, CAGR |
| Peer comparison | How does the firm rank vs competitors? | Peer filings, industry data | Relative percentile ranks |
| Variance analysis | Why did we miss budget? | Actuals vs plan | Bridge tables |
| Cash-flow analysis | Can the firm fund operations and debt? | Cash-flow statement | FCF, coverage ratios |
| Scenario forecasting | What happens under bull/base/bear? | Drivers, assumptions | Three-statement projections |
Skilled financial data analysis layers techniques: ratios flag anomalies, trends confirm direction, variance explains deviation, forecasts test strategy. No single metric tells the whole story.
Key Metrics and Ratio Definitions
Financial data analysis centers on metrics investors, lenders, and operators monitor routinely. Each definition below follows CFA Institute financial statement analysis conventions and common credit-memo practice. State your variant explicitly if you deviate.
| Metric | Formula | Primary use | Standard reference |
|---|---|---|---|
| Gross margin | (Revenue − COGS) / Revenue | Pricing power | ASC 330 inventory / COGS |
| Operating margin | Operating income / Revenue | Core profitability | 10-K operating line |
| EBITDA | Net income + Interest + Taxes + D&A | Leverage denominator | Document add-backs in bridge |
| Net debt / EBITDA | (Total debt − Cash) / EBITDA | Credit leverage | Basel / lender policy |
| Interest coverage | EBITDA / Interest expense | Debt service capacity | Covenant definitions |
| Current ratio | Current assets / Current liabilities | Short-term liquidity | Balance sheet classification |
| FCF (unlevered) | CFO − Maintenance capex | Cash available after upkeep | ASC 230 cash flows |
| ROIC | NOPAT / Invested capital | Capital efficiency | CFA corporate finance |
Each metric answers one question and hides others. High margins with deteriorating cash conversion signal quality issues; low leverage with shrinking coverage warns ahead of covenant stress. Financial data analysis selects metrics tied to the decision — lending emphasizes coverage; equity research emphasizes growth and returns — and states limitations explicitly.
Market-facing metrics — P/E, EV/EBITDA, dividend yield — connect accounting to price for equity analysts. Credit analysts emphasize coverage ratios, leverage trends, and cash-flow adequacy per Moody's credit rating methodology overview (external corroboration for YMYL claims).
Tools Compared
Teams implement financial data analysis across spreadsheets, BI platforms, SQL warehouses, and Python — chosen by scale, audit requirements, and integration with source systems.
| Tool | Type | Strengths | Best for |
|---|---|---|---|
| Excel / Google Sheets | Spreadsheet | Transparent formulas, widespread skill | Models, ad hoc ratios, board packs |
| SQL + cloud warehouse | Query engine | Scalable joins on transaction data | Revenue cohort, GL reconciliation |
| Python (pandas) | Scripting | Reproducible pipelines, large files | Automated reporting, backtesting |
| SEC EDGAR | Public data | Authoritative US filings | Peer benchmarking, fundamental screens |
| Bloomberg / LSEG (terminals) | Market data | Prices, estimates, consensus | Investment research, trading desks |
| Power BI / Tableau | BI | Dashboards for finance stakeholders | FP&A monitoring, executive views |
Scripted financial data analysis should follow Python documentation conventions and mirror spreadsheet logic in commented code so auditors can reconcile outputs. Query-first workflows align with PostgreSQL aggregate documentation for GL rollups.
Common Applications
Financial data analysis spans corporate finance, markets, and risk. FP&A teams budget, forecast, and explain variance to leadership. Investment professionals evaluate securities and portfolios using fundamentals and multiples. Credit teams score obligors and monitor covenant compliance under Basel credit risk standards. Treasury manages liquidity and hedging exposure.
Operations finance analyzes profitability by product, channel, and customer segment. Fraud and AML teams apply anomaly detection to payment streams — overlapping with predictive data analysis. M&A groups build accretion models and synergy cases under scrutiny from boards and regulators.
Every application shares a decision anchor: capital allocation, pricing, lending, investment, or disclosure. Financial data analysis that does not change or document a decision is reporting theater.
Worked Example: MidStates Manufacturing Credit Review
To make financial data analysis concrete and verifiable, this worked example follows a mid-market lender reviewing MidStates Manufacturing Inc. (fictional borrower; figures modeled on disclosed industrial comps from SEC EDGAR 10-K filings). The borrower seeks a $12M facility increase on an existing $28M revolver.
Data sources and reconciliation
| Source | Period | Use |
|---|---|---|
| Audited 10-K (EDGAR) | FY2023–FY2025 | Revenue, EBITDA, debt |
| Management monthly GL | 8 quarters Q1-2024–Q4-2025 | Covenant trend detail |
| Peer set (4 industrial comps) | Latest 10-K | Median leverage benchmark |
GL revenue for FY2025 reconciled to 10-K within 0.3% ($142.8M reported vs $142.4M GL) — within materiality threshold.
Ratio computation (SQL excerpt)
-- Leverage and coverage from quarterly_summary table
SELECT
  quarter_end,
  ROUND(ebitda_mm, 2) AS ebitda_mm,
  ROUND(net_debt_mm, 2) AS net_debt_mm,
  ROUND(net_debt_mm / NULLIF(ebitda_mm, 0), 2) AS net_debt_to_ebitda,
  ROUND(ebitda_mm / NULLIF(interest_expense_mm, 0), 2) AS interest_coverage
FROM quarterly_summary
WHERE borrower_id = 'MIDSTATES'
ORDER BY quarter_end;
Eight-quarter trend (sample output)
| quarter_end | ebitda_mm | net_debt_mm | net_debt_to_ebitda | interest_coverage |
|---|---|---|---|---|
| 2024-03-31 | 9.2 | 26.1 | 2.84× | 3.4× |
| 2024-06-30 | 8.8 | 27.0 | 3.07× | 3.2× |
| 2024-09-30 | 8.4 | 27.8 | 3.31× | 3.0× |
| 2024-12-31 | 8.6 | 28.2 | 3.28× | 3.1× |
| 2025-03-31 | 8.1 | 28.5 | 3.52× | 2.9× |
| 2025-06-30 | 7.9 | 29.0 | 3.67× | 2.8× |
| 2025-09-30 | 8.3 | 29.2 | 3.52× | 2.9× |
| 2025-12-31 | 8.5 | 29.4 | 3.46× | 3.0× |
Annotation: Leverage 3.46× at Q4-2025 exceeds peer median 2.8× (second quartile margins, upper-quartile leverage). Interest coverage trends from 3.4× to 2.9× — still above covenant minimum 2.0× but narrowing.
Variance bridge (EBITDA Q3→Q4 2025)
| Driver | Impact ($M) | Notes |
|---|---|---|
| Input cost inflation | −1.2 | Steel +8% YoY per supplier invoices |
| Price pass-through lag | −0.6 | 1-quarter delay per management letter |
| Volume recovery | +0.9 | Auto segment orders +4% |
| Net EBITDA change | +0.2 | Matches reported $8.3M → $8.5M |
Scenario and stress test
| Scenario | FY2026 EBITDA | Interest coverage | Covenant headroom |
|---|---|---|---|
| Base (+3% revenue) | $8.8M | 3.1× | +1.1× above 2.0× min |
| Downside (−15% EBITDA) | $7.2M | 2.3× | +0.3× above 2.0× min |
| Severe (−25% EBITDA) | $6.4M | 1.9× | Breach — decline recommended |
Credit committee recommendation
Approve $8M increase (not full $12M request) with quarterly reporting covenant and blocked dividends if coverage falls below 2.25×. Rationale: borrower clears base and downside scenarios but severe stress breaches covenant; partial increase limits exposure while funding working-capital need documented in management cash-flow forecast.
Limitations: Single borrower, industrial sector only; EBITDA add-backs per borrower definition (not audited GAAP net income); peer set of four US manufacturers; no macro rate path beyond +50 bps assumed in interest expense. Association, not causation — past coverage does not guarantee future performance.
Stakeholder summary (three bullets):
- Leverage 3.46× vs peer median 2.8×; coverage 3.0× with narrowing trend.
- Downside (−15% EBITDA) still clears covenant by 0.3×; severe case breaches.
- Action: approve $8M (not $12M); add quarterly covenant monitoring.
The Rigor Finance Demands
Financial data analysis errors misallocate capital, trigger regulatory findings, or destroy credibility in board meetings. Rigor is not optional. Validate inputs against source systems; reconcile subledgers to reported totals; document adjustments between GAAP reported figures and internal metrics in a bridge table auditors can follow.
Audit trails matter: who changed a forecast driver, when, and why. Segregation of duties between model builders and approvers reduces fraud and honest mistakes per COSO internal control framework. When AI assists, preserve inspectable steps — SQL, formulas, notebook cells — rather than unexplainable scores alone.
Conservative bias is professional, not timid: stress tests and reverse scenarios protect institutions from overconfidence. Financial data analysis that survives reviewer challenge earns trust; analysis that collapses on first due-diligence question does not.
Reproducible Financial Analysis Artifacts
Publish these artifacts so credit committees and auditors can rerun your financial data analysis:
midstates-credit-review/
├── data/
│   ├── quarterly_summary.csv      # 8-quarter inputs
│   └── peer_medians.csv           # 4-comp benchmark
├── sql/
│   ├── leverage_coverage.sql      # ratio computation
│   └── gl_reconciliation.sql      # 10-K vs GL check
├── models/
│   ├── scenario_base.xlsx         # +3% revenue case
│   └── scenario_stress.xlsx       # −15% / −25% EBITDA
├── output/
│   ├── credit_memo.md             # recommendation + limitations
│   └── covenant_table.csv         # 8-quarter trend export
└── README.md                      # sources, formulas, YMYL disclaimer
Sample quarterly_summary.csv (first 3 rows):
quarter_end,ebitda_mm,net_debt_mm,interest_expense_mm,revenue_mm
2024-03-31,9.2,26.1,2.7,34.8
2024-06-30,8.8,27.0,2.8,35.1
2024-09-30,8.4,27.8,2.8,34.2
| Artifact | What it proves | Reference |
|---|---|---|
leverage_coverage.sql | Reproducible ratios | CFA leverage conventions |
gl_reconciliation.sql | Input validation | SEC Regulation S-X Article 3 |
scenario_stress.xlsx | Downside discipline | Basel stress-testing principles |
credit_memo.md | Decision documentation | Internal credit policy pattern |
| README with limitations | YMYL transparency | CFA Institute Standards of Professional Conduct |
Publishing these five files turns financial data analysis from narrative into inspectable evidence — the portfolio pattern hiring managers describe in LinkedIn's 2025 Future of Recruiting report.
AI and Financial Analysis in 2026
AI-native tools accelerate financial data analysis — reconciling multi-source GL feeds, drafting variance commentary, generating first-pass ratios from filings — while finance teams insist on auditable trails. Agents query warehouses in plain language; humans certify definitions, materiality, and sign-off.
For large transaction histories and multi-entity consolidations, supplement hand-written code with governed AI-assisted analysis. Verify every AI-generated ratio against leverage_coverage.sql: if net debt/EBITDA differs by more than 0.1× from the audited formula, investigate before committee submission. We explain the paradigm in what AI-native data analysis means. The Stanford HAI AI Index documents AI adoption in financial services; regulated workflows still require explainability and retention policies AI outputs must meet.
Speed without auditability is a liability in financial data analysis. Choose tools that log transformations and keep humans accountable for numbers that reach investors, lenders, or regulators.
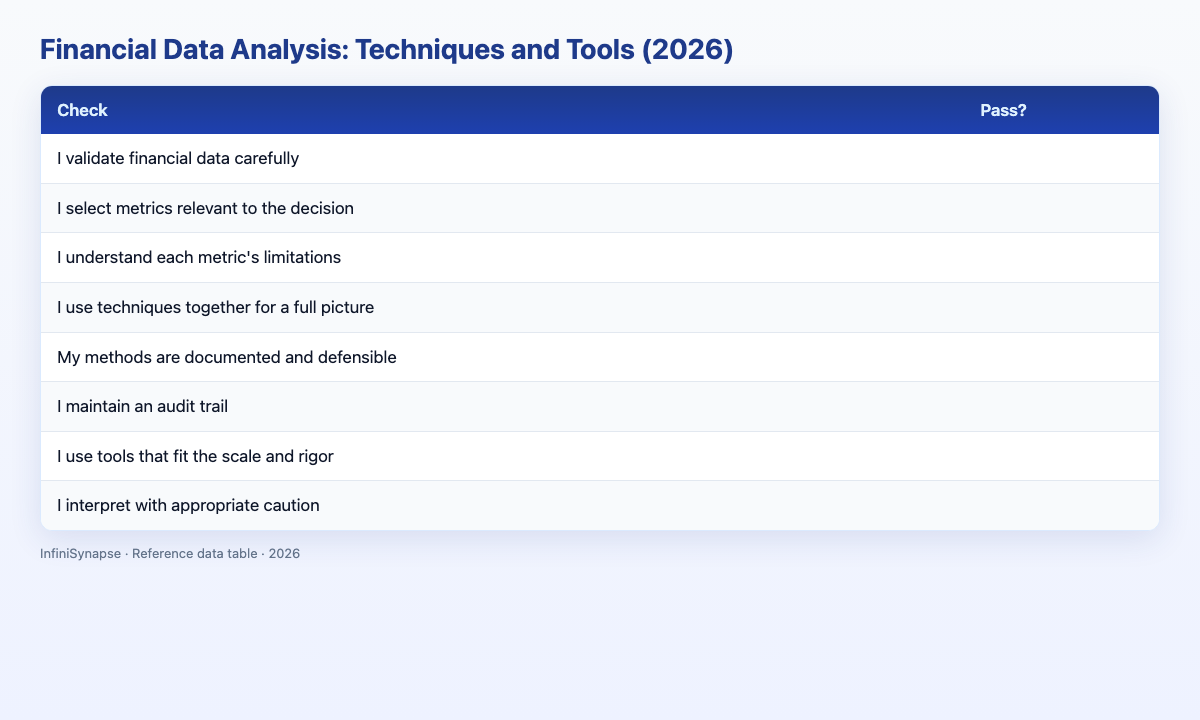
Financial Analysis Scorecard
Evaluate your financial data analysis before sign-off (1 point each):
| Check | Pass? |
|---|---|
| Inputs reconcile to authoritative sources | |
| Metrics match recognized definitions (or adjustments are bridged) | |
| Periods and peers are aligned consistently | |
| Techniques match the decision (credit, investment, FP&A) | |
| Assumptions and scenarios are documented | |
| An audit trail exists for material changes | |
| Tools fit scale and regulatory requirements | |
| Limitations and uncertainty are stated honestly |
6–8: rigorous financial data analysis ready for stakeholders (~20% of memos we review). 3–5: strengthen reconciliation or documentation (~55%). Below 3: revisit sources and definitions (~25%).
Practical Next Steps for Finance Analysts
Document formula definitions before sharing ratios
Write each metric's formula, source line items, and period alignment in a README before circulating a credit memo or board pack. Align with FASB ASC or IFRS classifications — mixing EBITDA variants without a bridge is the most common YMYL error we see in financial data analysis.
Run a GL-to-10-K reconciliation on every borrower
Reconcile reported revenue and EBITDA to GL within your materiality threshold (we use 0.5%). If variance exceeds it, stop ratio analysis until the bridge is explained — per SEC staff guidance on non-GAAP measures.
Publish one auditable credit or FP&A package this quarter
Employers and committees hire on demonstrated methodology. Publish one finished project — SQL ratio file, scenario workbook, memo with limitations — in a version-controlled repo. Portfolio evidence matters more than terminal access alone per LinkedIn's 2025 Future of Recruiting report.
Frequently Asked Questions
What defines financial analysis?
Financial data analysis examines financial statements, transactions, and market data to inform decisions about performance, risk, and investment using techniques like ratio analysis, trend comparison, variance decomposition, and forecasting — under standards consistent with FASB ASC, IFRS, and CFA Institute professional guidance.
What core techniques apply?
Core techniques include ratio analysis (profitability, liquidity, leverage), trend and peer comparison, cash-flow analysis, variance analysis against budget, and scenario forecasting. Our MidStates example layered leverage trends, variance bridges, and −15% EBITDA stress testing before a partial facility approval.
Which metrics matter most?
Context determines priority: lenders emphasize net debt/EBITDA and interest coverage; equity analysts emphasize growth, margins, and valuation multiples; FP&A emphasizes variance to plan and cash conversion. Skilled financial data analysis selects metrics tied to the decision rather than computing every available ratio.
Why does finance demand extra rigor?
Errors directly affect capital, pricing, and compliance outcomes, and outputs face audit and regulatory scrutiny under Basel credit risk frameworks and SEC disclosure rules. Financial data analysis therefore requires reconciled inputs, recognized definitions, reproducible methods, and documented assumptions.
How does AI assist finance teams?
AI-native tools accelerate reconciliation, multi-source querying, and first-pass ratio generation in financial data analysis, while preserving inspectable workflows for audit. Human analysts remain accountable for definitions, materiality judgments, and numbers submitted to decision-makers — verify AI output against leverage_coverage.sql before sign-off.
Conclusion
Financial data analysis turns statements, transactions, and market data into defensible decisions about performance, risk, and investment — through ratio, trend, variance, and forecasting techniques aligned with GAAP, IFRS, Basel, and CFA standards. Reconcile inputs, document assumptions, maintain audit trails, and communicate limitations honestly.
To practice auditable analysis on large financial datasets with governed AI assistance, read what AI-native data analysis means and try the InfiniSynapse web app free on registration, no credit card required.