Microsoft Office Excel Data Analysis: 2026 Walkthrough
By the InfiniSynapse Data Team · Last updated: 2026-07-09 · We build an AI-native data analysis platform and work inside Microsoft 365 environments daily; this walkthrough reflects how Office Excel fits real teams, not a license brochure.

Table of Contents
- TL;DR
- How We Evaluated
- Where Excel Sits Inside Microsoft 365
- The Office Excel Analysis Workflow
- Power Query and OneDrive in Practice
- Sharing Results Across Office Apps
- Excel vs Google Sheets vs Power BI vs Python
- When Office Excel Is Not Enough
- Selection Scorecard
- Practical Next Steps
- Frequently Asked Questions
- Conclusion
TL;DR
Direct answer: microsoft office excel data analysis is the default path for millions of Microsoft 365 users who already live in Outlook, Teams, Word, and PowerPoint. Excel inside Office handles import, cleaning, pivots, and charts on modest data; Power Query and co-authoring extend it, but scale, multi-source governance, and recurring automation still push teams toward Power BI or scripted Python.
Who this is for: analysts and managers running microsoft office excel data analysis inside a Microsoft 365 tenant.
What you'll learn: how we evaluated the Office workflow, the end-to-end steps, collaboration patterns, comparisons to alternatives, and clear handoff signals.
This walkthrough sits within the data analysis tools hub; for Excel as a standalone tool assessment, see Excel as a data analysis tool. For related depth, see Excel data analysis: complete how-to and Microsoft Excel Data Analysis: Advanced Techniques.
How We Evaluated
We assessed microsoft office excel data analysis workflows against what Microsoft 365 teams actually do in 2026: import files from email and SharePoint, shape tables with Power Query, summarize with pivots, publish charts into slide decks, and revisit the same workbook monthly. Each step was checked against Microsoft Learn Excel training paths, Excel support documentation, and Office integration guidance—not isolated feature demos.
How We Evaluated: What To Verify
We cross-referenced analytical rigor with the Wikipedia data analysis overview, enterprise adoption patterns in IBM's augmented analytics overview, and how quickly agent-assisted preparation matured per the Stanford HAI AI Index. We also compared microsoft office excel data analysis outcomes to parallel tasks in Google Sheets, Power BI, and Python on the same sample exports.
How We Evaluated: In Practice
Governance and repeatability matter. A workbook that lives only on a laptop and breaks when a column shifts delivers less value than a refreshable pipeline—even if the first version shipped faster inside Office.## Where Excel Sits Inside Microsoft 365 Microsoft office excel data analysis is not a separate product; it is the analytical layer inside a suite teams already pay for. Email attachments land in Excel, cleaned tables paste into Word memos, charts embed into PowerPoint decks, and links circulate in Teams channels. That embedded position is why Office Excel survives enterprise renewals even when IT pilots newer platforms.
The suite advantage is frictionless handoff. An analyst can finish microsoft office excel data analysis in a workbook stored on OneDrive, share a view-only link in Teams, and let a manager open the same file during a stand-up without exporting PDFs. Co-authoring—two people editing one workbook simultaneously—works when files live in SharePoint or OneDrive, though heavy models still favor single-editor discipline to avoid formula conflicts.
Where Excel Sits Inside: In Practice
The suite disadvantage is boundary blur. Because Excel is so easy to open, teams sometimes force warehouse-scale questions into a grid that was built for quick tables. Knowing when microsoft office excel data analysis should stay in Excel versus when it should feed Power BI or Python is the skill that separates smooth rollouts from fragile workbooks.## The Office Excel Analysis Workflow
Reliable microsoft office excel data analysis follows a repeatable sequence regardless of industry. First, define the decision the numbers must support—not the chart type you prefer. Second, import and structure: one row per observation, consistent column headers, dates stored as dates. Third, clean: trim text, standardize categories, flag nulls. Fourth, summarize with pivots or formulas. Fifth, visualize and narrate the finding in plain language.
Power Query belongs in step two for any file you will refresh. Instead of re-opening a CSV and repeating delete-column steps, microsoft office excel data analysis practitioners record transforms once and click refresh when new data arrives. Microsoft Learn's Get & Transform documentation walks through the interface; the habit matters more than any single button.
Practical example: a marketing coordinator in a Microsoft 365 tenant receives weekly campaign exports from three ad platforms. She stores raw files in a SharePoint folder, uses Power Query to append them into one table, builds a pivot of cost per acquisition by channel, and pastes the chart into the Monday leadership deck. Microsoft office excel data analysis covers the full loop without leaving Office. When leadership asks to join CRM revenue and product margin from Snowflake every morning, that is the signal to add Power BI on top while keeping Excel for ad-hoc what-if tweaks.
Power Query and OneDrive in Practice
Power Query is the bridge that keeps microsoft office excel data analysis from devolving into copy-paste archaeology. Connect to CSV, Excel, SharePoint lists, or databases; apply transforms; load to the grid or data model. The query steps are visible and editable, which preserves some of the transparency that makes spreadsheets trustworthy.
OneDrive and SharePoint versioning add a safety net. When a colleague breaks a formula during co-authoring, version history can restore yesterday's working microsoft office excel data analysis file. Still, treat shared workbooks like shared code: designate an owner, lock calculation sheets if needed, and document refresh instructions on a README tab.
For teams comparing cloud spreadsheets, note that Google Workspace offers similar live editing but different desktop power features. Microsoft office excel data analysis generally leads on Power Query depth, desktop performance, and integration with PowerPoint—at the cost of heavier files and stricter IT policies.
Sharing Results Across Office Apps
The last mile of microsoft office excel data analysis is communication. A pivot alone rarely changes a decision; a chart embedded in a slide with a one-sentence recommendation does. Excel-linked objects in PowerPoint refresh when the workbook updates—if paths and permissions remain valid—so monthly reviews can reuse the same deck skeleton.
Word suits narrative supplements: methodology notes, caveats, definitions. Teams channels suit alerts: "March churn rose 2.1 points—workbook linked." This orchestration is why microsoft office excel data analysis persists: the numbers stay inspectable in Excel while the story travels in formats executives already open.
Avoid screenshot sprawl. Static images hide formulas and stale quickly. Prefer linked charts or paste values with a clear as-of date in the caption. IBM's augmented analytics overview emphasizes that trust in analytics depends on traceability—easy to forget when slides look polished.
Excel vs Google Sheets vs Power BI vs Python
Teams running microsoft office excel data analysis eventually ask what to add next. The table below compares Excel inside Office to the three alternatives we see most often in Microsoft-heavy enterprises.
| Dimension | Excel | Google Sheets | Power BI | Python |
|---|---|---|---|---|
| Best for | Ad-hoc math, pivots, quick charts on modest tables | Lightweight collaboration and shared live sheets | Governed dashboards and recurring executive reporting | Custom statistics, ML, and reproducible pipelines |
| Data scale | Comfortable to ~500K rows; slows beyond | Similar ceiling; cloud row limits vary by plan | Warehouse-backed; millions of rows via models | Unlimited with engineering and compute |
| Collaboration | Desktop-first; co-authoring via OneDrive | Real-time multi-user editing native | Publish-and-consume dashboards for wide audiences | Notebooks and Git for technical teams |
| Statistics | Formulas plus optional Analysis ToolPak add-in | Built-in basics; fewer advanced stats | DAX modeling; not a full stats package | Full ecosystem (pandas, SciPy, statsmodels) |
| Automation | Macros, Power Query, Office Scripts | Apps Script | Scheduled refresh and semantic models | Scripts, schedulers, orchestration tools |
| Learning curve | Lowest; ubiquitous in business | Low; familiar grid metaphor | Moderate; data modeling concepts required | Steep; programming fluency expected |
Inside Microsoft 365, Power BI is the natural upward step when microsoft office excel data analysis files become recurring dashboards consumed by dozens of viewers. Python enters when custom statistics or ML dominate. Google Sheets appears when external partners refuse Microsoft accounts. None of these choices retires Excel; they change where the system of record lives.
Training matters as much as tooling. New hires who only know pivot basics will still export CSVs to email when SharePoint and Power Query would save hours. Assign a short onboarding path from Microsoft Learn Excel training and pair it with a real departmental dataset so microsoft office excel data analysis habits form on live work—not abstract exercises.
When Office Excel Is Not Enough
Microsoft office excel data analysis hits hard limits when row counts approach seven figures, when joins span more than two sources with different refresh cadences, or when compliance requires row-level audit trails Excel was never designed to store. Symptoms include hour-long recalculations, VLOOKUP chains nobody dares edit, and monthly all-nighters to rebuild the same deck.
Hand off preparation and refresh to Power BI or a warehouse query layer; keep Excel for final what-if tweaks if stakeholders demand the grid. The Stanford HAI AI Index tracks how quickly agent-assisted layers matured to absorb exactly this repetitive glue work. For statistical depth beyond the ToolPak, see Excel Data Analysis ToolPak before jumping to Python.
Security and compliance teams increasingly ask where workbook copies live. Store canonical microsoft office excel data analysis files in governed libraries, restrict external sharing on sensitive tabs, and label exports with as-of timestamps so recipients know whether they are viewing a snapshot or a live link.
Selection Scorecard
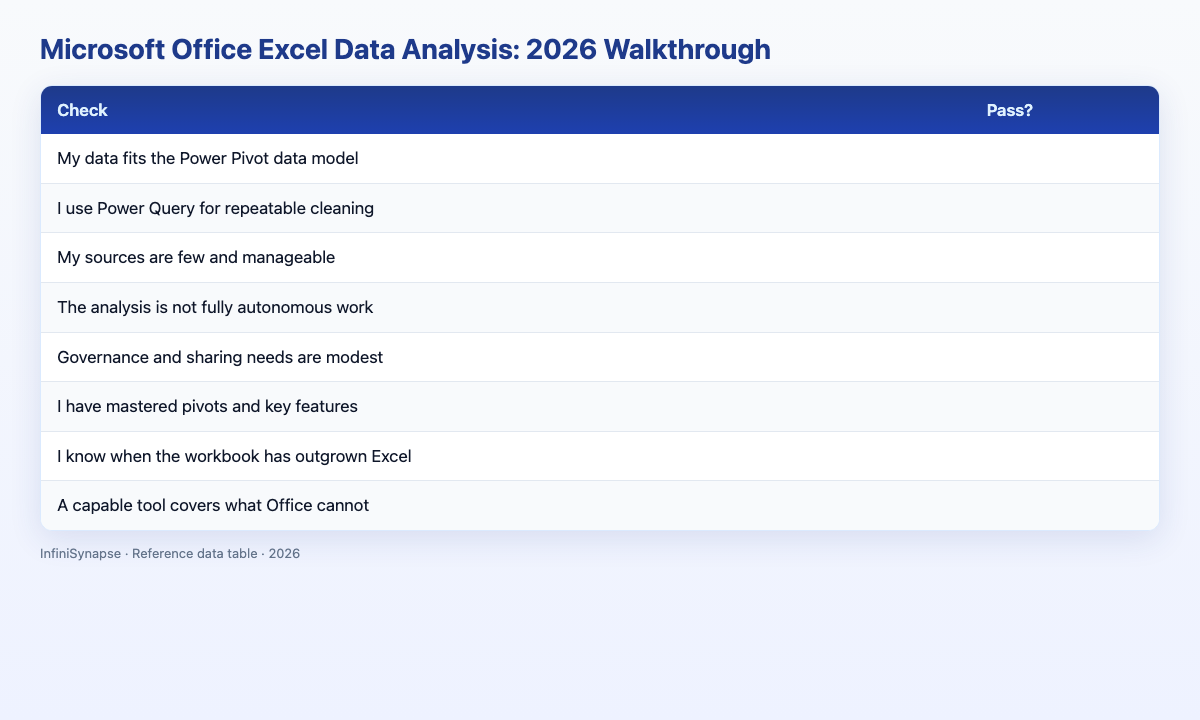
Judge whether microsoft office excel data analysis fits your next project (1 point each):
| Check | Pass? |
|---|---|
| Data fits comfortably in a single workbook | |
| Sources refresh on a schedule Power Query can handle | |
| Audience is small or accepts workbook links | |
| Co-authoring and SharePoint governance are in place | |
| The question is ad-hoc or monthly, not real-time ops | |
| I document transforms instead of one-off edits | |
| I know when to publish to Power BI instead | |
| Stakeholders can inspect formulas if challenged |
6–8: Office Excel is the right primary surface. 3–5: use Excel with a planned handoff. Below 3: start in Power BI or Python and export views to Office.
Practical Next Steps
Verify against real job postings
Before committing time or budget, pull five recent job postings in your target market and list the SQL, visualization, and communication skills each repeats. Align your learning plan to those patterns rather than a generic syllabus.
Ship one portfolio artifact this month
Employers hire on demonstrated ability. Publish one finished analysis — with a clear question, reproducible queries, and a short executive summary — alongside any credential or course completion.
Frequently Asked Questions
What is Microsoft Office Excel data analysis?
Microsoft office excel data analysis is the practice of importing, cleaning, summarizing, and visualizing data inside Excel as part of a Microsoft 365 workflow—often alongside SharePoint, Teams, Word, and PowerPoint. It covers the same core spreadsheet skills as standalone Excel with added collaboration and suite integration.
How do I start Microsoft Office Excel data analysis?
Start with a clear question, import data via Power Query, clean headers and types, build a pivot or summary table, chart the result, and share a OneDrive link or linked slide. Follow Microsoft Learn Excel training for structured modules if you are new to the grid.
Is Office Excel enough for a data team?
For ad-hoc and modest recurring work, microsoft office excel data analysis is often enough. Data teams outgrow it when they need governed semantic models, warehouse-scale joins, or reproducible pipelines—then Power BI and Python typically join the stack.
How does Office Excel relate to Power BI?
Excel explores and prototypes; Power BI publishes governed dashboards at scale. Many teams prototype in microsoft office excel data analysis, then promote stable metrics to Power BI datasets. The tools are complements inside Microsoft 365, not strict replacements.
When should I leave Excel for Python?
Move to Python when you need custom statistics, machine learning, strict reproducibility with tests, or automation beyond Power Query's comfort zone. Keep microsoft office excel data analysis for stakeholder-facing what-if models if the grid remains the negotiation surface.
Conclusion
Microsoft office excel data analysis remains the fastest on-ramp for Microsoft 365 organizations: familiar grid, Power Query refresh, suite-wide sharing, and inspectable formulas. Master the workflow, document transforms, and promote work to Power BI or Python when scale, governance, or repetition demand it.
To practice the AI-era skills employers want, read what AI-native data analysis means and try the InfiniSynapse web app free on registration, no credit card required.