Predictive Data Analysis: Methods and Uses (2026)
By the InfiniSynapse Data Team · Last updated: 2026-07-09 · We build an AI-native data analysis platform and evaluate predictive workflows against how forecasts are actually validated and used in decisions.
Table of Contents
- TL;DR
- How We Evaluated Predictive Methods
- What Prediction Adds Beyond Description
- Core Methods and Model Families
- Tools Compared
- Common Business Uses
- A Practical Churn Prediction Example
- Keeping Forecasts Honest
- AI and Prediction in 2026
- Predictive Analysis Scorecard
- Practical Next Steps
- Frequently Asked Questions
- Conclusion
TL;DR
Direct answer: predictive data analysis uses patterns in historical data to forecast future outcomes — churn, demand, fraud risk — through statistical and machine-learning models in scikit-learn and specialized libraries like Prophet. It delivers value when organizations act on forecasts, but only if models are validated on held-out data and uncertainty is communicated honestly.
Who this is for: analysts learning predictive data analysis or evaluating whether a forecasting initiative is worth the investment.
What you'll learn: how we evaluated predictive methods, core model families, tool comparisons, a churn walkthrough, validation discipline, pitfalls, and how AI-native workflows fit.
This guide sits within the advanced methods hub. For related depth in this pillar, see Bayesian Data Analysis: Intuition First and Financial Data Analysis: Techniques and Tools. For where prediction fits analytically, see types of data analysis.
How We Evaluated Predictive Methods
We selected predictive data analysis methods for this guide using criteria that reflect how forecasting actually succeeds or fails in production in 2026 — not leaderboard accuracy alone. Each approach was checked against four dimensions: whether enough relevant historical data exists with stable generative patterns, whether the model was validated on temporally or randomly held-out data the trainer never saw, whether predictions include uncertainty or calibration metrics stakeholders can interpret, and whether the forecast connects to a decision with measurable value.
How We Evaluated Predictive: What To Verify
We cross-referenced these criteria with the analytical taxonomy in the Wikipedia data analysis overview and with supervised learning foundations in the Wikipedia machine learning overview. Predictive data analysis sits at the forward-looking end of that spectrum: it extrapolates learned patterns rather than summarizing the past. The scikit-learn model selection guide encodes validation discipline we treat as non-negotiable — cross-validation, train-test splits, and leakage checks before any model reaches stakeholders.
How We Evaluated Predictive: In Practice
Interpretability and maintainability matter alongside AUC. A complex ensemble that nobody can explain or retrain delivers less organizational value than a modest logistic regression with documented features. We favor methods with transparent documentation and pipelines aligned to employer tool lists — Python with scikit-learn, SQL for feature extraction, time-series libraries where seasonality dominates. IBM's augmented analytics overview describes how enterprises govern model-assisted decisions; the Stanford HAI AI Index tracks how quickly AI agents democratized model building while human judgment on validity remains the bottleneck.## What Prediction Adds Beyond Description
Descriptive analysis tells you what happened; diagnostic analysis explores why. Predictive data analysis asks what is likely next — which customers will leave, which transactions are fraudulent, what demand looks like next quarter. That forward orientation enables preparation: retention campaigns before churn, inventory before spikes, reviews before defaults.
The defining constraint is stability. Predictive data analysis assumes future cases resemble past cases in ways the model captures. When markets shift, products pivot, or policies change, historical patterns break. Practitioners must monitor drift and retrain — prediction is maintenance, not a one-time script.
Used with humility, predictive data analysis converts historical signal into actionable foresight. Used without validation, it converts historical noise into confident wrong answers — worse than no model at all.
Core Methods and Model Families
Predictive data analysis spans several model families matched to outcome type and data structure. Linear and logistic regression remain baselines for numeric and binary outcomes — interpretable, fast, and often competitive after thoughtful feature engineering. Tree-based models — random forests, gradient boosting via XGBoost — capture nonlinear interactions with modest tuning. Neural networks suit large unstructured inputs but sacrifice transparency.
Time-series forecasting uses dedicated methods: exponential smoothing, ARIMA, and Prophet for business series with seasonality and holidays. Classification targets categories ( churn yes/no ); regression targets continuous values ( revenue ); ranking targets ordered priorities ( lead scores ).
The table below maps methods to typical questions. Select by outcome type first, then by interpretability needs.
| Method family | Outcome type | Typical use | Common tool |
|---|---|---|---|
| Logistic regression | Binary classification | Churn, default flags | scikit-learn |
| Random forest / XGBoost | Classification or regression | Tabular prediction with interactions | scikit-learn, XGBoost |
| ARIMA / ETS | Univariate time series | Short-horizon numeric forecasts | statsmodels |
| Prophet | Business time series | Seasonality + holiday effects | Prophet |
| Survival models | Time-to-event | Retention, equipment failure | lifelines, scikit-survival |
| Neural networks | Complex patterns | Text, image, large tabular | PyTorch, TensorFlow |
Advanced predictive data analysis adds feature stores, automated retraining, and monitoring — but the core remains: define the outcome, engineer features without leakage, validate honestly, deploy with uncertainty.
Tools Compared
Teams implement predictive data analysis primarily in Python, with R and SQL supporting feature pipelines. The comparison below reflects stacks we see in production analytics and data-science groups.
| Tool | Role | Strengths | Best for |
|---|---|---|---|
| scikit-learn | ML library | Unified API, extensive models, CV utilities | General tabular prediction |
| XGBoost | Boosting library | Strong tabular performance | Large structured datasets |
| Prophet | Forecasting | Seasonality, holidays, missing data | Operational demand forecasting |
| statsmodels | Statistics | ARIMA, regression diagnostics | Econometric and classical TS |
| MLflow | Experiment tracking | Model registry, reproducibility | Governed enterprise ML |
| SQL + warehouse | Feature source | Scalable joins, point-in-time features | Feature engineering at scale |
Scripted predictive data analysis should follow Python documentation conventions: version control, pinned dependencies, and documented train-serve splits. Query-first feature engineering aligns with concepts in the Wikipedia SQL overview.
Common Business Uses
Predictive data analysis appears across industries when anticipation enables action. Retail and supply chain teams forecast demand to staff warehouses and negotiate inventory. Subscription businesses predict churn to target retention offers. Banks and fintech score credit and fraud risk before approving transactions. Manufacturers predict equipment failure for preventive maintenance.
Marketing uses response models to allocate spend; healthcare stratifies readmission risk; insurers estimate claims severity. The common thread is decision lead time — predictive data analysis pays off when acting before the outcome saves money, reduces risk, or captures opportunity.
Each use case demands domain-appropriate metrics: precision-recall when false negatives are costly, calibration when probability thresholds drive budgets, MAPE or pinball loss for demand curves. Matching metrics to stakes is part of professional predictive data analysis.
A Practical Churn Prediction Example
A SaaS company wants to flag accounts likely to cancel within sixty days. The analyst pulls twelve months of usage logs, support tickets, and billing history from the warehouse, defining churn from subscription end dates. She engineers features at a thirty-day prediction horizon — login frequency trend, seats active, payment failures — using point-in-time joins so future information never leaks into training rows.
She trains a logistic regression baseline and an XGBoost model in scikit-learn, evaluating both with time-based cross-validation because random splits would inflate scores on temporal data. The gradient-boosted model achieves 0.78 AUC on held-out months; calibration plots show predicted 20% churn buckets realize near 19% actual churn. She delivers a scored account list weekly with expected value = retention offer cost × predicted save probability.
Practical example: the model ships with a monitoring dashboard tracking AUC and calibration monthly — predictive data analysis degrades when product or pricing changes. Documenting features, validation protocol, and retrain triggers matches the demonstrated-outcome standard that Harvard Business Review's skills-based hiring research and IBM's augmented analytics overview describe for governed forecasting.
Keeping Forecasts Honest
Honesty separates trustworthy predictive data analysis from harmful overconfidence. Every forecast is uncertain; responsible work communicates ranges, probabilities, or confidence intervals — not false precision. Validate on held-out data the model never saw; for time series, respect temporal order in splits. Document the business event calendar alongside features so reviewers see whether a spike reflects product change or model failure.
Overfitting — memorizing noise — is the cardinal sin. Guard with cross-validation, regularization, and simpler model baselines. Watch for data leakage: future information smuggled into features destroys real-world performance. When covariates shift ( concept drift ), retrain or pause deployment.
Track forecasts against outcomes over time. A model that predicted well last year but fails this quarter loses trust; recorded track records rebuild it. Transparency about limitations — "patterns assume stable pricing" — protects decision-makers from betting beyond evidence.
AI and Prediction in 2026
AI-native platforms make predictive data analysis more accessible: agents draft feature SQL, suggest algorithms, and produce first-pass models from natural-language prompts. That acceleration helps teams start faster but does not replace validation, leakage checks, or uncertainty communication.
For warehouse-scale work, supplement hand-written code with governed AI-assisted analysis. We explain the paradigm in what AI-native data analysis means. The Stanford HAI AI Index documents rapid adoption of agent-assisted modeling; human analysts still own metric choice, temporal validation, and the decision of when a forecast is trustworthy enough to act on.
Interpretability requirements — common in regulated domains — may favor simpler scikit-learn models over opaque deep nets even when AI suggests otherwise. Predictive data analysis in 2026 is as much about judgment as about algorithms.
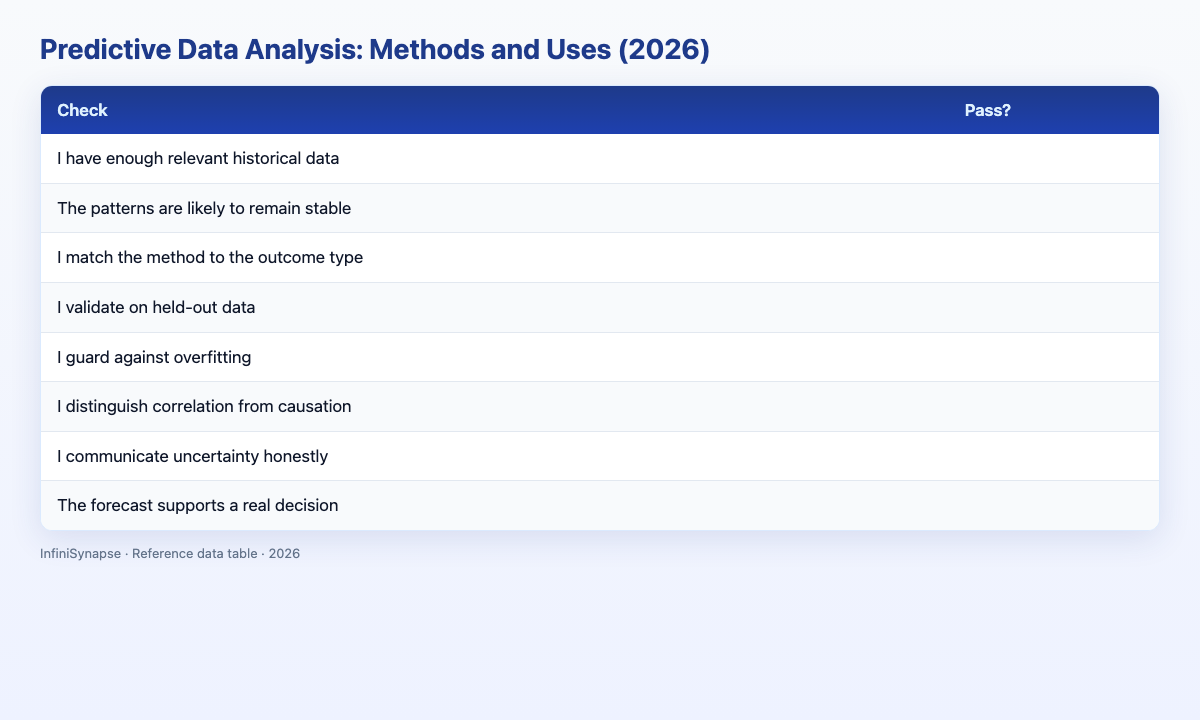
Predictive Analysis Scorecard
Evaluate your predictive data analysis before deployment (1 point each):
| Check | Pass? |
|---|---|
| I have sufficient, relevant historical data | |
| Patterns are likely stable over the forecast horizon | |
| I matched the method to outcome type ( classify / regress / forecast ) | |
| Validation uses held-out or time-based splits | |
| I checked for feature leakage | |
| I report uncertainty or calibration, not point guesses alone | |
| Metrics align with business costs of errors | |
| Monitoring and retrain triggers are defined |
6–8: sound predictive data analysis ready for decisions. 3–5: strengthen validation or communication. Below 3: revisit fundamentals before deploying.
Practical Next Steps
Verify against real job postings
Before committing time or budget, pull five recent job postings in your target market and list the SQL, visualization, and communication skills each repeats. Align your learning plan to those patterns rather than a generic syllabus.
Frequently Asked Questions
What is predictive analysis?
Predictive data analysis uses historical data to forecast future outcomes through statistical and machine-learning models — regression, classification, time-series methods — implemented in tools like scikit-learn and Prophet. It enables organizations to prepare rather than react when forecasts are validated and uncertainty is communicated.
What methods power prediction?
Common methods include logistic and linear regression, random forests, XGBoost, ARIMA, and Prophet for seasonality. Method choice depends on whether the outcome is categorical, numeric, or temporal, and on interpretability requirements detailed in the scikit-learn user guide.
What are common prediction use cases?
Uses include demand forecasting, customer churn prediction, fraud detection, credit scoring, predictive maintenance, healthcare risk stratification, and marketing response modeling — anywhere anticipating an outcome creates time to act.
How do you keep predictions honest?
Keep predictive data analysis honest with held-out validation, leakage checks, calibration assessment, and explicit uncertainty communication. Monitor deployed models for drift and maintain a track record comparing forecasts to outcomes, as recommended in rigorous ML practice and IBM augmented analytics governance frameworks.
How does AI assist forecasting?
AI-native tools accelerate feature engineering, model prototyping, and SQL generation for predictive data analysis, lowering the skill barrier to first drafts. Analysts still own validation design, metric selection, and deciding when predictions are reliable enough for high-stakes decisions.
Conclusion
Predictive data analysis turns historical patterns into forecasts that enable action — through validated models in scikit-learn, XGBoost, and Prophet, with uncertainty communicated honestly. Match methods to outcome types, validate without leakage, monitor drift, and tie every model to a decision it improves. The best predictive data analysis teams maintain a forecast track record: what was predicted, what happened, and what changed in the business when scores diverged. Review that log quarterly with product and finance so models retire before silent drift misallocates retention spend or inventory. Pair every deployment checklist with a rollback plan: which metric breach pauses scoring and who approves a retrain before the next billing cycle begins.
To practice governed forecasting workflows with AI assistance, read what AI-native data analysis means and try the InfiniSynapse web app free on registration, no credit card required.