Programs for Data Analysis: A Beginner's Guide for 2026
By the InfiniSynapse Data Team · Last updated: 2026-07-09 · We build an AI-native data analysis platform and help newcomers choose software every week; this guide reflects hands-on evaluation of beginner-friendly programs, not a feature race.
Table of Contents
- TL;DR
- How We Evaluated These Programs
- What Makes a Good Beginner Program
- Named Programs Compared
- Spreadsheets: The Gentle Start
- BI Programs for Visualization
- Code Programs: Python and R
- AI-Native Programs in 2026
- A Starter Path That Works
- Selection Scorecard
- Practical Next Steps
- Frequently Asked Questions
- Conclusion
TL;DR
Direct answer: the best programs for data analysis for beginners in 2026 are spreadsheets for fundamentals, a BI program such as Tableau Public or Power BI Desktop for visualization, and increasingly an AI-native agent for plain-language questions—with Python and R as the next step once you need custom logic. Start with the lowest learning curve that answers your question and graduate only when you hit a real wall.
Who this is for: newcomers choosing among programs for data analysis without prior experience.
What you'll learn: how we evaluated options, what separates good beginner programs from weak ones, a named comparison of Tableau, Power BI, Looker, Python, and spreadsheets, a starter path, and a selection scorecard.
This beginner-focused guide sits under the data analysis tools hub. For a budget-oriented roundup, see best data analysis software. For related depth in this pillar, see Analytical Tools for Data Analysis and Software for Data Analysis: Free vs Paid in 2026.
How We Evaluated These Programs
We selected programs for data analysis for this shortlist using criteria that mirror what hiring managers list in 2026 job postings, not brand prestige alone. Each option was checked against five dimensions: learning curve and time to first result, connection breadth to real files and databases, preparation power on messy data, visualization and communication output, and whether the program supports AI-assisted workflows. We cross-referenced skill requirements with the Bureau of Labor Statistics occupational profile for data analysts, which lists analytical, communication, and technical skills as core competencies, and hiring-trend data from LinkedIn's 2025 Future of Recruiting report, which notes that skills assessments and portfolio evidence increasingly influence hiring alongside formal credentials.
How We Evaluated These: In Practice
Price, format, and completion rates matter too. A programs for data analysis choice you abandon halfway delivers less value than a shorter free program you finish and turn into portfolio work. We favor options with transparent documentation, public learner reviews from working analysts, and capabilities aligned with tools employers actually list—SQL, Excel or Google Sheets, a BI platform, and basic statistical reasoning. The underlying activity is the same across every option, as the Wikipedia data analysis overview describes: acquire data, clean it, analyze it, and communicate the result.## What Makes a Good Beginner Program A worthwhile entry among programs for data analysis shares several traits regardless of price. First, it produces a real result quickly—sorting a file, building a chart, or answering a plain-language question within a day. Second, it connects to data you actually have, whether that is a spreadsheet export, a CSV, or a database you can authorize. Third, it teaches as you use it, exposing the logic behind the output rather than hiding it in a black box.
Weak options fail on one or more of these dimensions. Some emphasize theory without enough hands-on work; others require weeks of setup before the first answer. A program that promises mastery in a weekend or that focuses on button-clicking without analytical thinking will not prepare you for real work. Evaluate any candidate against the skills in data analyst skills and the process described in the Wikipedia data analysis overview before committing.
What Makes A Good: In Practice
In 2026, a good beginner program also acknowledges AI-assisted analysis. As agents automate routine cleaning and querying, employers value analysts who can direct these tools effectively and validate their outputs. The move toward augmented workflows, outlined in IBM's augmented analytics overview, frames how teams evaluate modern tooling. The table below maps the capabilities we see most often in entry-level analyst postings. Use it as a checklist when comparing programs for data analysis.
| Program type | Learning curve | Best for | Typical ceiling |
|---|---|---|---|
| Spreadsheets (Excel / Google Sheets) | Very low | Fundamentals, ad hoc work | ~500K rows, manual joins |
| BI (Tableau Public, Power BI Desktop) | Low–medium | Dashboards, portfolio pieces | Assumes clean input |
| Python (pandas, matplotlib) | Medium–high | Custom logic, ML, reproducibility | Unlimited with skill |
| R (tidyverse, ggplot2) | Medium–high | Statistics, research graphics | Unlimited with skill |
| AI-native agents | Low | Multi-source questions, preparation | Depends on connector breadth |
The table below compares the programs for data analysis beginners most often ask about. Official documentation is linked so you can verify features before installing anything.
| Program | Category | Free tier | Strength | Official docs |
|---|---|---|---|---|
| Tableau Public | BI / visualization | Yes (public save only) | Interactive charts, portfolio engine | Tableau Public help |
| Power BI Desktop | BI / visualization | Yes (publish requires license) | Microsoft integration, DAX modeling | Power BI documentation |
| Looker Studio | BI / visualization | Yes | Google-ecosystem dashboards | Looker Studio help |
| Google Sheets | Spreadsheet | Yes | Zero install, collaboration | Google Sheets help |
| Python + pandas | Code | Yes | Unlimited flexibility, reproducibility | Python documentation |
Tableau Public leads on visual polish and public portfolio sharing; Power BI Desktop leads on price within Microsoft shops; Looker Studio suits teams already in Google Workspace. None of these programs for data analysis replaces the others—they occupy different layers. For a deeper BI comparison, see top data analysis platforms.
Practical example: a career changer who learns Google Sheets for fundamentals, builds two dashboards in Tableau Public on open government datasets, and documents the SQL behind each chart in a portfolio README can cite live links in applications. Recruiters see the dashboards as proof of visualization skill and the written reasoning as proof of analytical thinking—the combination that Harvard Business Review's skills-based hiring research describes as increasingly decisive in hiring decisions.
Spreadsheets: The Gentle Start
For most beginners, a spreadsheet is the correct first program among programs for data analysis. Google Sheets and Excel open instantly, require no installation in the case of Sheets, and let you sort, filter, chart, and pivot without specialized knowledge. Nearly everyone has seen a spreadsheet before, which removes the intimidation that steeper options create.
The gentle learning curve comes with a real ceiling. Spreadsheets slow down past a few hundred thousand rows, struggle to join data from multiple sources, and make recurring analysis tedious because each cycle is largely manual. Those limits are exactly the walls that tell you when to graduate. Until you hit them, though, a spreadsheet teaches the fundamentals of data analysis better than any heavier program, because nothing sits between you and the numbers. Our guide to using Excel for data analysis covers where that ceiling sits in detail.
BI Programs for Visualization
Once you can sort and chart in a spreadsheet, a BI program is the natural next step among programs for data analysis. Tableau Public and Power BI Desktop both offer free entry points and teach visualization principles through drag-and-drop interfaces. Tableau Public saves work publicly, which makes it ideal for learning and portfolios; Power BI Desktop saves locally but requires a paid license to publish to a workspace.
Both BI programs for data analysis assume reasonably clean input and do limited preparation of their own. Clean the data in a spreadsheet or SQL first, then connect the file and build views around a clear question. The Stanford HAI AI Index notes how visualization literacy has become a baseline expectation, and a public Tableau profile or Power BI sample file demonstrates exactly that literacy to hiring managers.
Code Programs: Python and R
Python and R are the most powerful beginner-accessible programs for data analysis, but they ask for a genuine investment. With libraries like pandas and matplotlib in Python, or tidyverse and ggplot2 in R, you can do essentially anything, and both are free and open-source. The catch is that both require learning to code.
For a motivated beginner willing to spend weeks building fluency, that investment pays off in unlimited capability and reproducible work. For someone who simply needs an answer this afternoon, code is the wrong first program, because the learning curve stands between them and the result. The honest advice is to reach for Python or R when you have hit the walls of spreadsheets and BI tools and specifically need custom logic, machine learning, or fully scripted pipelines. Free interactive modules on Kaggle Learn and SQLBolt pair well with either language.
AI-Native Programs in 2026
The most important shift for beginners in 2026 is that one of the most capable programs for data analysis is now also one of the easiest: the AI-native agent. Instead of learning formulas or syntax first, you describe your question in plain language and receive an answer along with the query that produced it, which doubles as a way to learn how analysis works under the hood.
For warehouse-scale or multi-source work, supplement spreadsheets or BI tools with hands-on AI practice. We explain the paradigm in what AI-native data analysis means, and the Stanford HAI AI Index tracks how quickly agent-assisted analysis matured. A beginner can connect a spreadsheet or a database with one-click authorization, ask a question in ordinary words, and watch the agent plan the steps, run the analysis, and explain what it did. Warehouse-grounded analytics should align with Databricks documentation on SQL warehouses and data governance.
A Starter Path That Works
The efficient path through these programs for data analysis is a deliberate progression rather than an attempt to learn everything at once. Begin with a spreadsheet to grasp sorting, filtering, and charting on small data. Add a free BI program or AI-native tier almost immediately, so you can build portfolio dashboards or ask harder questions in plain language.
Only when you hit a specific wall—data too large, a method a spreadsheet lacks, or a need for fully custom logic—should you invest in learning Python or R. This progression avoids the classic beginner trap of spending months learning to code before answering a single real question. Most newcomers discover that a spreadsheet plus a BI program or agent carries them much further than they expected, and by the time they need code, they understand their own requirements well enough to learn efficiently.
Selection Scorecard
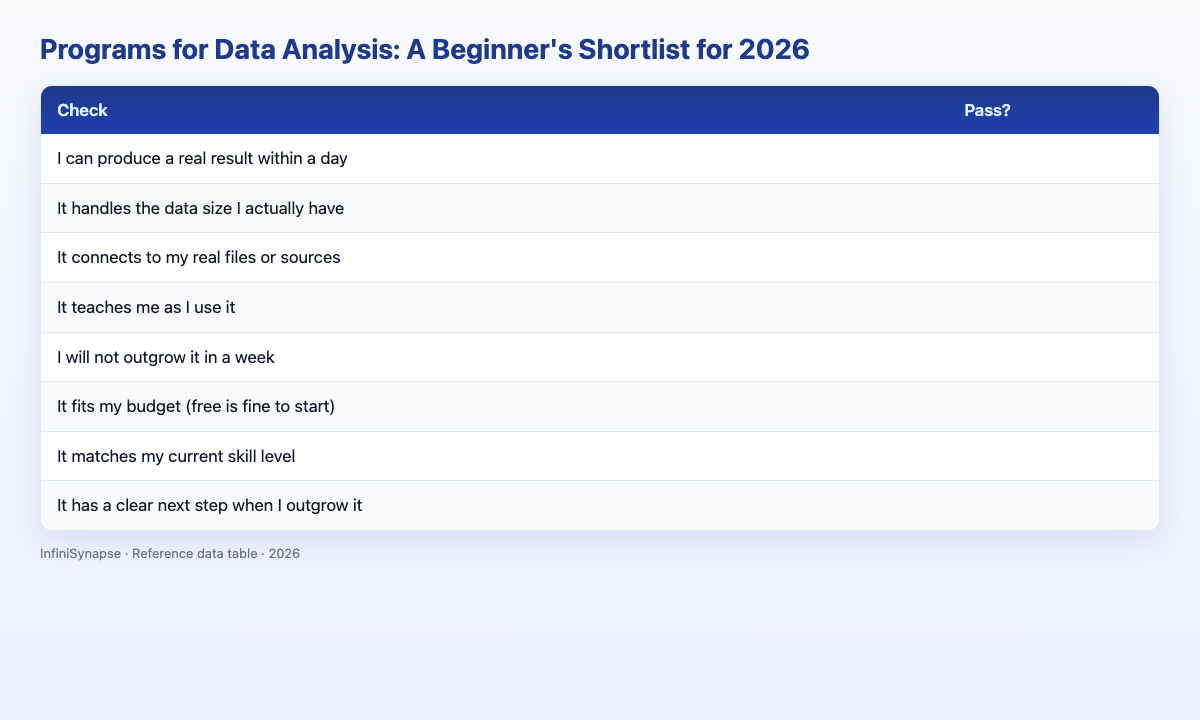
Score any beginner program among your programs for data analysis (1 point each):
| Check | Pass? |
|---|---|
| I can produce a real result within a day | |
| It handles the data size I actually have | |
| It connects to my real files or sources | |
| It teaches me as I use it | |
| I will not outgrow it in a week | |
| It fits my budget (free is fine to start) | |
| It matches my current skill level | |
| It has a clear next step when I outgrow it |
6–8: a good first program. 3–5: fine for a narrow start. Below 3: pick something gentler.
Practical Next Steps
Verify against real job postings
Before committing time or budget, pull five recent job postings in your target market and list the SQL, visualization, and communication skills each repeats. Align your learning plan to those patterns rather than a generic syllabus.
Ship one portfolio artifact this month
Employers hire on demonstrated ability. Publish one finished analysis — with a clear question, reproducible queries, and a short executive summary — alongside any credential or course completion.
Frequently Asked Questions
What are the best programs for data analysis for beginners?
The best programs for data analysis for beginners are spreadsheets like Excel or Google Sheets for fundamentals, paired with a BI program such as Tableau Public or Power BI Desktop for visualization. Python and R are excellent next steps once you need more power, but they require learning to code, so most beginners start with the first two and add an AI-native agent for plain-language questions.
Which program should I learn first for data analysis?
Learn a spreadsheet first, because it teaches the fundamentals with the gentlest learning curve, then add a free BI program or AI-native agent so you can build dashboards or ask harder questions in plain language. Move to Python or R only when you hit a specific wall that those simpler programs for data analysis cannot clear.
Are free programs for data analysis good enough for beginners?
Yes. Free programs for data analysis—Google Sheets, Tableau Public, Power BI Desktop, Python, R, and AI-native free tiers—are more than enough for beginners. A spreadsheet plus a free BI program or agent covers a large share of real analysis without spending anything, and you can invest later once you know your needs.
Do I need to learn coding to analyze data?
No. Spreadsheets and AI-native agents let you analyze data without coding, and AI-native programs for data analysis specifically let you ask questions in plain language. Coding with Python or R unlocks custom methods and machine learning, but it is a later step, not a prerequisite.
How does an AI-native agent help a beginner?
An AI-native agent lets a beginner ask questions in plain language and returns both an answer and the query behind it, which teaches how analysis works. It connects to real files and databases, handles larger data than a spreadsheet, and removes the coding barrier that makes other programs for data analysis intimidating at first.
Conclusion
The best programs for data analysis for a beginner are the ones with the lowest learning curve that still answer your question—usually a spreadsheet plus a BI program or AI-native agent, with Python and R waiting for when you need real power. Start low, practice on real questions, and graduate only when a genuine wall forces you to.
The fastest way to begin is to ask a question in plain language and watch how it is answered. See how AI-native data analysis works and try the InfiniSynapse web app free on registration, no credit card required.