Python Data Analysis: The Complete 2026 Guide
By the InfiniSynapse Data Team · Last updated: 2026-07-09 · We build an AI-native data analysis platform and run Python in production daily; this guide reflects how teams actually choose libraries, workflows, and handoffs in 2026.
Table of Contents
- TL;DR
- How We Evaluated Analytical Python
- Why Python Dominates Analytical Work
- Core Libraries Compared
- The Analytical Workflow in Code
- When to Code Versus Delegate
- Five-Method Pillar Map
- Python Versus Other Approaches
- Cluster Guides in This Pillar
- Python Readiness Scorecard
- Frequently Asked Questions
- Conclusion
TL;DR
Direct answer: python data analysis uses libraries like pandas, NumPy, and matplotlib to clean, transform, model, and visualize data with reproducible code. It offers unlimited flexibility for statistics, machine learning, and automated pipelines, at the cost of programming skill. In 2026, it pairs with AI-native agents that handle routine steps while code covers custom logic.
Who this is for: analysts, engineers, and team leads evaluating python data analysis as part of a modern analytical stack.
What you'll learn: how we evaluated the ecosystem, which libraries matter, the end-to-end workflow, when to write code versus delegate, how this pillar maps five method families, and where to go deep next.
This hub maps the advanced-methods pillar. For getting started, see python for data analysis; for a worked case, see data analysis with python. For query-first work, see SQL data analysis.
How We Evaluated Analytical Python
We assessed python data analysis for this guide using criteria that mirror production team decisions, not tutorial popularity alone. Each library and workflow pattern was checked against four dimensions: data preparation power on messy real files, performance at row counts teams actually hit, reproducibility when the same analysis reruns monthly, and whether outputs can be validated by a second analyst without reverse-engineering a notebook.
We cross-referenced the underlying activity with the Wikipedia overview of data analysis, which frames analysis as inspecting, cleaning, transforming, and modeling data to surface useful information. We aligned autonomy expectations with IBM's augmented analytics overview, which tracks how AI-assisted workflows reshape what teams expect from analytical tooling. The Stanford HAI AI Index documents how quickly agent-assisted analysis moved from research into daily practice—a shift that changed how we weight delegation versus hand-written code. For language and library baselines we referenced the Python documentation and the pandas user guide.
The table below summarizes the evaluation dimensions we apply when recommending python data analysis tooling to a team.
| Evaluation dimension | Why it matters in 2026 | What we tested |
|---|---|---|
| Preparation power | Dirty exports are the norm | Load CSV, JSON, and warehouse extracts; handle missing values and type errors |
| Scale | Spreadsheets choke first | Same grouped aggregation at 100K, 1M, and 10M+ rows |
| Reproducibility | Recurring reports must rerun | Versioned scripts and notebooks; identical output on refresh |
| Modeling depth | Not every question is a pivot | Stats and ML libraries when descriptive work is not enough |
| Visualization | Stakeholders need charts | Honest axes, labeled units, code-generated updates |
| Handoff clarity | SQL often pulls; Python transforms | Clean boundary between query layer and notebook layer |
| Agent compatibility | Routine steps can delegate | Compare hand-written code to AI-generated equivalents on known answers |
| Maintainability | Code outlives the author | Readable structure, documented assumptions, testable functions |
Why Python Dominates Analytical Work
Python data analysis became the default in industry because one readable language spans ad-hoc exploration, production pipelines, and machine learning without switching stacks. Python is free, open-source, and backed by a vast library ecosystem purpose-built for tabular data, time series, text, and models. That breadth means a team can start with a CSV on a laptop and later deploy the same logic against a warehouse—provided someone maintains the code.
The trade-off is real: python data analysis requires programming skill and disciplined project structure. Spreadsheets and BI tools offer faster first answers on small, clean tables. Where Python wins is scale, custom logic, and reproducibility—every transformation is explicit code that reruns when data updates. The general process Python implements matches the stages described in the Wikipedia data analysis overview; Python is the execution layer for teams that outgrow point-and-click limits.
In 2026, python data analysis also sits naturally beside AI-native agents. Agents handle routine cleaning and standard aggregations from plain-language goals; Python remains the place for bespoke statistics, novel features, and pipelines that must pass code review. IBM's augmented analytics overview describes this split as augmented rather than replaced human judgment—a pattern we see in every mature data team.
Core Libraries Compared
The power of python data analysis comes from a small set of libraries that cover most production work. Choosing among them is less about brand and more about which layer of the stack your question touches: arrays, tables, charts, models, or notebooks.
| Library | Role | Best for | Official link |
|---|---|---|---|
| pandas | Tabular data structures | Loading, cleaning, grouping, joining | pandas.pydata.org |
| NumPy | Numerical arrays | Fast vector math underpinning pandas | numpy.org |
| matplotlib | Base plotting | Publication-style charts from code | matplotlib.org |
| seaborn | Statistical visualization | Distribution and relationship plots | seaborn.pydata.org |
| scikit-learn | Machine learning | Classification, regression, clustering | scikit-learn.org |
| Jupyter | Notebook environment | Interactive step-by-step analysis | jupyter.org |
| statsmodels | Statistical models | Regression, time series, inference | statsmodels.org |
Pandas is the foundation of most python data analysis projects because the DataFrame maps cleanly to business tables. NumPy sits underneath for performance. Visualization libraries turn grouped results into charts stakeholders can read. Scikit-learn and statsmodels extend the same workflow into modeling when descriptive summaries are not enough. The pandas documentation remains the authoritative reference for table operations; the Python documentation covers language fundamentals for readable scripts.
Learning this handful deeply beats skimming dozens of packages. Most valuable python data analysis work uses load-clean-transform-group-visualize patterns in pandas, with modeling libraries added only when the question requires them.
The Analytical Workflow in Code
A typical python data analysis workflow follows the same stages as any rigorous analysis, expressed as code. You load data into a pandas DataFrame, inspect dtypes and missing values, clean and join as needed, compute metrics through grouping or custom functions, visualize results, and interpret findings toward a decision. Jupyter makes this interactive: run one cell, inspect output, then proceed.
Load and inspect
Read from CSV, Parquet, or a database connector; print head(), info(), and row counts before trusting aggregates. Surprises at this stage—currency stored as text, duplicate keys—prevent silent errors later in python data analysis.
Clean and transform
Express deduplication, type coercion, and missing-value rules as code so they rerun on refresh. Cleaning is where python data analysis often spends the most time; skipping it produces confident wrong answers.
Analyze and visualize
Group, aggregate, pivot, or merge to answer the question; plot with matplotlib or seaborn. Because charts are code, they regenerate when upstream data changes—a reproducibility advantage spreadsheets struggle to match at scale.
Interpret and document
Connect metrics to decisions, note limitations, and save the notebook or script under version control. Reproducibility is a core reason teams adopt python data analysis for recurring work. We walk through a full retail example in data analysis with python.
Practical example: a product analyst at a mid-size e-commerce company receives weekly order exports of 2.4 million rows. She uses python data analysis in pandas to dedupe on order ID, parse revenue fields, group by category and week, and flag the fastest-growing segment for merchandising. She publishes the notebook to an internal repo and presents a 15% week-over-week lift in accessories with inspectable code—exactly the demonstrated-outcome evidence that Harvard Business Review's skills-based hiring research describes as increasingly decisive in hiring and promotion decisions.
When to Code Versus Delegate
Not every analytical task deserves a custom script. Python data analysis by hand is worth the effort when you need custom logic, novel statistical methods, machine learning features, or a pipeline that must pass engineering review and run on a schedule.
For routine cleaning, standard aggregations, and first-pass charts, AI-native agents can now execute multi-step goals from plain language and return inspectable queries or code. The pragmatic 2026 split: delegate the repeatable skeleton, then use python data analysis for the bespoke layer agents do not cover. The Stanford HAI AI Index tracks how quickly that division became normal in production teams.
Verify agent output the same way you review a colleague's notebook: check row counts after joins, sanity-check totals, and rerun on a held-out slice. Pattern knowledge from python data analysis is what makes that verification fast rather than guesswork.
Five-Method Pillar Map
This pillar organizes advanced analytical methods into five families. Python data analysis anchors the code-based family; the others cover query languages, alternate statistical stacks, qualitative interpretation, and specialized quantitative domains.
Python and notebooks
Scripted analysis with pandas, NumPy, and visualization libraries. Best for custom transforms, modeling, and reproducible pipelines. Start with python for data analysis and data analysis with python.
SQL and warehouse querying
Retrieve and summarize data where it lives. Best for aggregation at scale before export. See SQL data analysis and data analysis using SQL.
R and statistical computing
Deep statistical tradition and specialized packages. Best when your field standardizes on R. Compare in R for data analysis.
Qualitative and mixed methods
Systematic interpretation of interviews, text, and observations. Best when the question is about meaning, not counts. Start with qualitative data analysis.
Specialized quantitative domains
Survey design, spatial work, Bayesian inference, prediction, and finance-specific methods. Examples include survey data analysis, Bayesian data analysis, and predictive data analysis.
Mature teams mix families: SQL pulls governed aggregates, python data analysis models and customizes, qualitative work explains the "why" behind a metric shift. The map below shows where each family sits relative to data scale and interpretive depth.
| Method family | Primary tooling | Best for | Hub guide |
|---|---|---|---|
| Python / notebooks | pandas, scikit-learn, Jupyter | Custom pipelines, ML, reproducible code | python for data analysis |
| SQL / warehouses | PostgreSQL, Snowflake | Large-scale aggregation in place | SQL data analysis |
| R | CRAN ecosystem | Academic stats, specialized models | R for data analysis |
| Qualitative | CAQDAS, coding frameworks | Themes, interviews, open text | qualitative data analysis |
| Specialized quantitative | Domain libraries | Surveys, geo, Bayesian, finance | financial data analysis |
Python Versus Other Approaches
Versus spreadsheets
Spreadsheets win ad-hoc speed on modest tables; python data analysis wins scale, joins across large files, and automated reruns. Use a spreadsheet for a five-minute answer; use Python when the same question returns weekly on millions of rows.
Versus SQL alone
SQL excels at filtering and aggregating in the database. python data analysis excels at complex transforms, statistical models, and glue code between systems. Most stacks use both: SQL for extraction, Python for everything after.
Versus R
R remains strong in academic statistics; Python leads in general-purpose engineering and industry hiring. Overlap is large; choice often follows team skill and existing codebases, as discussed in R for data analysis.
Cluster Guides in This Pillar
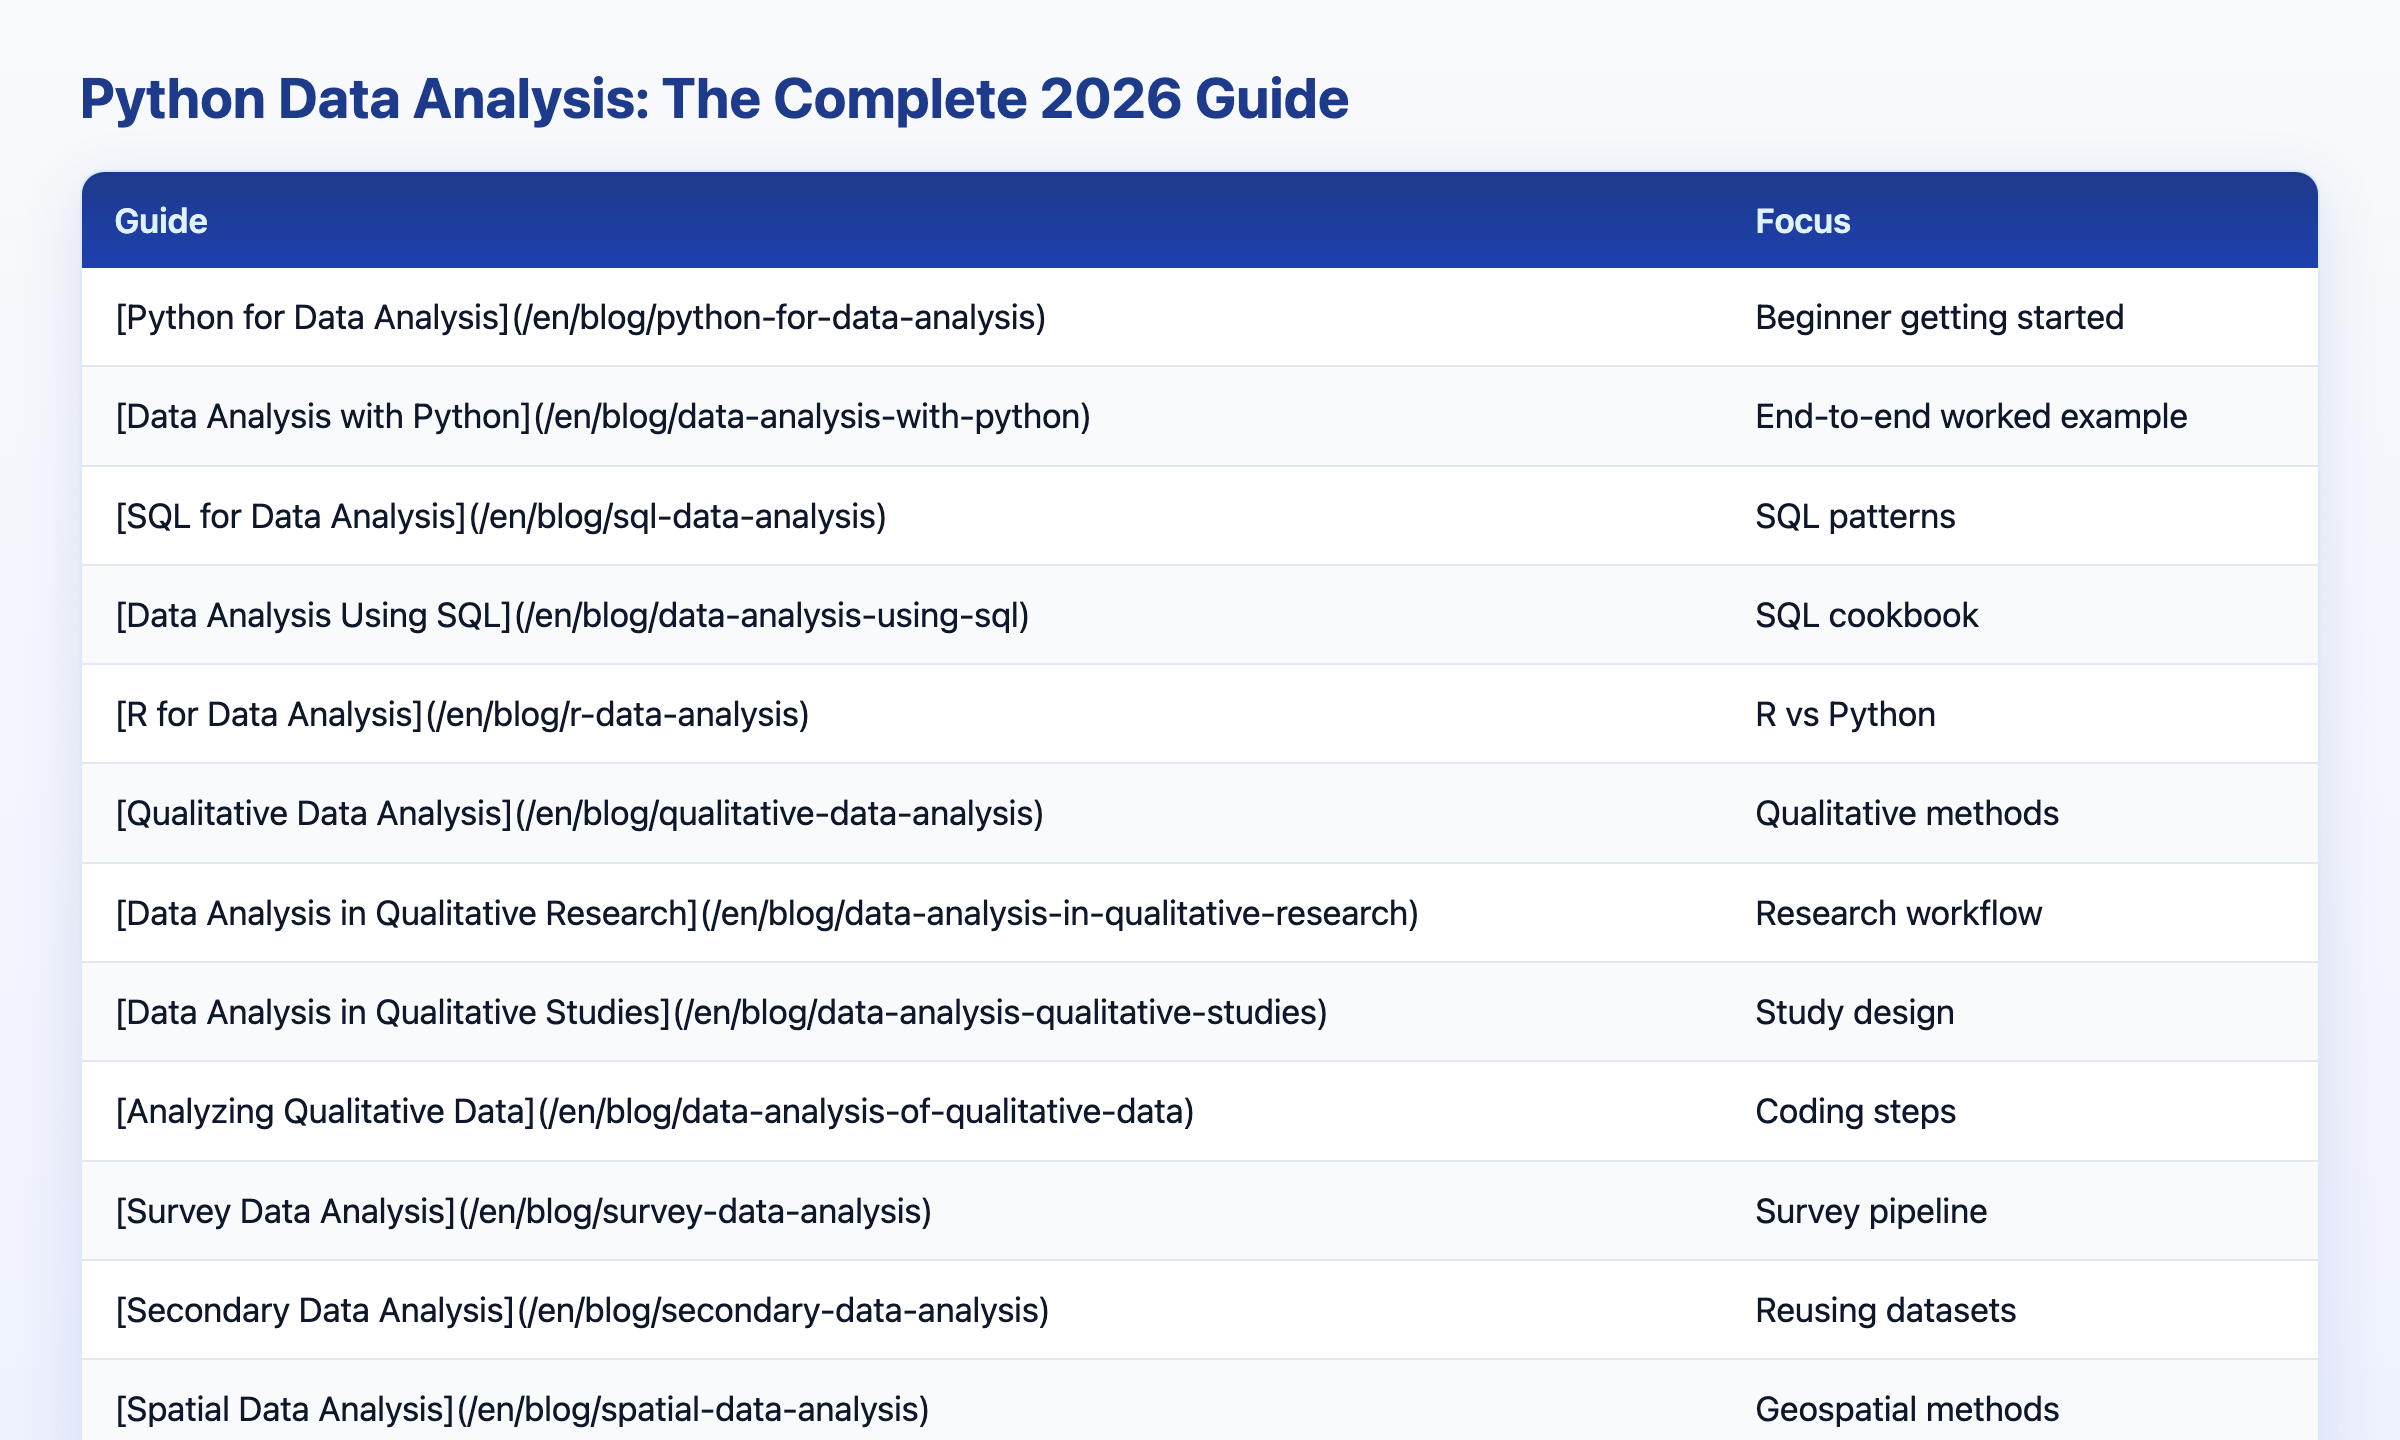
This hub is the map; the guides below go deep on each language and method. Use them when you have narrowed python data analysis versus another family and need product- or method-level depth.
| Guide | Focus |
|---|---|
| Python for Data Analysis | Beginner getting started |
| Data Analysis with Python | End-to-end worked example |
| SQL for Data Analysis | SQL patterns |
| Data Analysis Using SQL | SQL cookbook |
| R for Data Analysis | R vs Python |
| Qualitative Data Analysis | Qualitative methods |
| Data Analysis in Qualitative Research | Research workflow |
| Data Analysis in Qualitative Studies | Study design |
| Analyzing Qualitative Data | Coding steps |
| Survey Data Analysis | Survey pipeline |
| Secondary Data Analysis | Reusing datasets |
| Spatial Data Analysis | Geospatial methods |
| Topological Data Analysis | TDA concepts |
| Bayesian Data Analysis | Bayesian workflow |
| Predictive Data Analysis | Predictive modeling |
| Financial Data Analysis | Finance methods |
Python Readiness Scorecard
Evaluate whether your team should rely on python data analysis for production work (1 point each):
| Check | Pass? |
|---|---|
| We can load and inspect a CSV with pandas | |
| We can filter, group, and aggregate without manual copy-paste | |
| We can join two tables on a shared key and verify row counts | |
| We can plot at least one honest chart with labeled axes | |
| We can explain findings to a non-technical stakeholder | |
| We know when to write code versus delegate to an agent | |
| We version notebooks or scripts for reproducibility | |
| We can validate AI-generated code before trusting outputs |
6–8: ready to rely on Python for production analysis (top ~20% of teams we advise). 3–5: keep practicing core pandas skills (~45% of learners). Below 3: start with guided exercises before custom projects.
Frequently Asked Questions
What does analytical Python involve?
Python data analysis uses libraries like pandas, NumPy, and matplotlib to clean, analyze, and visualize data with code. It supports statistics, machine learning, and reproducible pipelines for teams willing to maintain programming skill. It dominates industry because flexibility and ecosystem depth outweigh the learning investment for complex or recurring work.
Which libraries should I learn first?
The core libraries are pandas for tabular manipulation, NumPy for numerical arrays, matplotlib and seaborn for visualization, and scikit-learn and statsmodels for modeling. Jupyter is the standard interactive environment. Mastering pandas and one plotting library covers most everyday tasks before adding specialized packages.
Is Python hard to learn for data analysis?
Python data analysis requires learning to program, but the path is manageable if you focus on pandas first and practice on real datasets. Most production work uses a small set of operations—load, clean, group, join, plot—rather than advanced computer science. Structured courses and agent-generated examples can accelerate early learning without replacing hands-on practice.
When should I use Python versus an AI-native tool?
Use Python when you need custom logic, novel statistics, machine learning, or pipelines under code review. Use an AI-native agent for routine cleaning, aggregation, and standard charts from plain-language goals. The efficient 2026 workflow combines both: agents for speed on repeatable steps, Python for bespoke work agents cannot safely own.
Can agents replace hand-written Python?
No. AI-native tools complement Python by handling routine analysis and generating starter code, but custom modeling, regulated pipelines, and novel feature engineering still require human-written Python. Teams that verify agent output with solid pandas fluency get the best of both layers.
Conclusion
Python data analysis remains the flexible, reproducible backbone of serious analytical work—built on pandas, NumPy, and a rich library stack, paired in 2026 with agents that absorb routine steps. Map your question to the five method families in this pillar, master the core libraries, and reserve hand-written code for work where custom logic and auditability matter most.
To practice agent-assisted workflows alongside code, read what AI-native data analysis means and try the InfiniSynapse web app free on registration, no credit card required.