Python for Data Analysis: Getting Started in 2026
By the InfiniSynapse Data Team · Last updated: 2026-07-09 · We build an AI-native data analysis platform and onboard analysts onto Python weekly; this guide reflects the fastest sound path from zero to a first real project.
Table of Contents
- TL;DR
- How We Evaluated Getting Started Paths
- Why Start With Python
- Setting Up Your Environment
- What to Learn First
- Beginner Tools Compared
- A Beginner Workflow
- Your First Real Analysis
- Avoiding Beginner Mistakes
- How AI Accelerates Learning
- A Realistic Learning Timeline
- Getting-Started Scorecard
- Frequently Asked Questions
- Conclusion
TL;DR
Direct answer: getting started with python for data analysis means installing Python and a notebook, learning just enough language syntax to work with data, and focusing on pandas—which handles most everyday tasks. Practice the load-clean-analyze-visualize cycle on real datasets, add libraries as needs arise, and avoid tutorial hell by finishing one complete project early.
Who this is for: beginners taking their first steps with python for data analysis in 2026.
What you'll learn: how we evaluated learning paths, environment setup, priority skills, a named-tool comparison, a repeatable workflow, common mistakes, and a realistic timeline.
This guide sits within the advanced methods hub. For an end-to-end worked case, see data analysis with python. For query-first work, see SQL data analysis.
How We Evaluated Getting Started Paths
We assessed python for data analysis onboarding paths using criteria that match what hiring managers expect from junior analysts in 2026: hands-on pandas fluency, a completed portfolio project, basic visualization, and awareness of when to delegate routine steps to agents. Each learning route was checked against official documentation, time-to-first-analysis, and whether graduates could rerun work without instructor prompts.
We cross-referenced skill expectations with the Wikipedia overview of data analysis, which describes the inspect-clean-transform-communicate cycle that every sound path must teach. IBM's augmented analytics overview frames how beginners should think about AI-assisted practice alongside manual coding. The Stanford HAI AI Index documents how quickly agent-generated examples became a normal learning aid. For technical baselines we used the Python documentation and the pandas getting started guide.
The table below maps what we look for when recommending a python for data analysis learning sequence.
| Skill area | Why it matters in 2026 | Typical timeline |
|---|---|---|
| Environment setup | Broken installs stop more beginners than hard concepts | Week 1 |
| Language basics | Enough to read and write data operations | Weeks 1–2 |
| pandas load/inspect | Every project starts here | Weeks 2–3 |
| Cleaning and types | Dirty data causes silent errors | Weeks 3–4 |
| Grouping and joins | Core of most business questions | Weeks 4–6 |
| Visualization | Stakeholders need charts, not only tables | Weeks 5–7 |
| First portfolio project | Proof beats certificates alone | By week 8 |
| Agent verification | Validate AI-generated code before trusting it | Ongoing |
Why Start With Python
Choosing python for data analysis as your first serious analytical language is a sound decision for most career paths. Python is readable, widely used in industry, and supported by an enormous community—abundant tutorials, Stack Overflow answers, and employer demand. Unlike niche tools, python for data analysis scales from a first CSV summary to machine learning without changing languages.
The same disciplined process described in the Wikipedia data analysis overview applies whether you use a spreadsheet or code; Python gives you reproducible execution of that process at scale. For the broader ecosystem map, see the python data analysis hub.
Setting Up Your Environment
Getting started with python for data analysis begins with a working environment. Install a distribution that bundles Python with key data libraries—Anaconda, Miniconda, or pip inside a virtual environment—so you analyze immediately instead of debugging PATH variables. Open a Jupyter notebook and confirm import pandas succeeds before moving on.
Jupyter lets you run code in small cells and see output inline—the natural rhythm for python for data analysis. Do not over-invest in perfect tooling on day one; a working notebook that loads a CSV is enough. The Python documentation and pandas installation guide cover troubleshooting when imports fail.
What to Learn First
The efficient path into python for data analysis focuses ruthlessly on high-frequency skills. Learn variables, lists, dictionaries, loops, and functions—enough to read pandas examples—then invest heavily in pandas itself: loading data, inspecting with head() and info(), selecting rows and columns, handling missing values, grouping, aggregating, and joining tables.
Add matplotlib once manipulation feels comfortable. One honest bar chart or line chart with labeled axes beats a dozen unused libraries. Defer statistics and machine learning until a specific question requires them. Depth in pandas returns more value than breadth across packages you may never touch in your first year of python for data analysis practice.
Beginner Tools Compared
Beginners often ask which stack to install first. The table compares the environments and libraries most common in python for data analysis courses and job postings.
| Tool | Role | Best for beginners | Official link |
|---|---|---|---|
| Python | Language runtime | Required foundation | python.org |
| pandas | Tabular analysis | Daily cleaning and aggregation | pandas.pydata.org |
| Jupyter | Notebook UI | Step-by-step learning | jupyter.org |
| NumPy | Array math | Underpins pandas performance | numpy.org |
| matplotlib | Plotting | First charts from code | matplotlib.org |
| VS Code | Editor | Scripts and notebooks in one IDE | code.visualstudio.com |
You do not need every row on day one. python for data analysis beginners should install Python, pandas, and Jupyter, then add tools when a project demands them.
A Beginner Workflow
A reliable workflow for python for data analysis mirrors the general analytical process in code: load the file into a DataFrame and check row counts, column types, and missing values; clean by fixing types, dropping or filling nulls, and removing duplicates; analyze through grouping, aggregation, or new calculated columns; then visualize and interpret in plain language. Repeating this cycle across datasets builds fluency faster than passive video watching.
Working in a notebook, run each step and verify output before continuing. That rhythm catches errors early and mirrors how experienced practitioners structure python for data analysis in code review—small, inspectable cells rather than one giant script that fails silently halfway through.
Your First Real Analysis
The best way to learn python for data analysis is to finish one project on data you care about—public open data or a sanitized export from your job. Pick a clear question, run the full workflow, and publish the notebook or a short write-up.
Keep the first project small and complete: monthly sales by region beats an abandoned machine-learning ambition. When stuck, search for the exact pandas operation; the community has answered nearly every beginner error. Completing one arc reveals which skills to deepen next.
Document your first project in a short README: data source, question, key cleaning decisions, and one chart screenshot. That artifact becomes interview material and proves you can finish python for data analysis work end to end—not only follow along in a course video.
Practical example: a marketing coordinator learning python for data analysis downloads a public e-commerce dataset, loads it in pandas, cleans duplicate order IDs, groups revenue by product category, and charts the top five categories. She adds the notebook to her portfolio and cites the project in applications. Recruiters treat the live artifact as proof of execution—the combination of credential and demonstrated skill that Harvard Business Review's skills-based hiring research identifies as increasingly decisive over brand-name certificates alone.
Avoiding Beginner Mistakes
Tutorial hell—endlessly following exercises without an original question—builds familiarity, not skill. Start your own project by week two. Too many libraries at once scatters attention; master pandas before Spark, deep learning, or niche packages. Skipping cleaning produces wrong answers regardless of elegant code. Disorganized notebooks forfeit reproducibility, Python's main advantage—name files clearly and keep a linear narrative from load to conclusion.
Peer review helps: ask a colleague or community forum to skim your notebook for unclear variable names or missing sanity checks. External eyes catch gaps you normalize after hours solo. That feedback loop accelerates python for data analysis competence more than another passive course module.
How AI Accelerates Learning
In 2026, AI assistants meaningfully accelerate python for data analysis learning by generating example code for tasks you describe—code you study, run, and adapt. Agents can also perform a full analysis from a plain-language goal, showing the underlying steps your pandas code will eventually implement.
Treat AI output as a draft to verify, not gospel. Compare agent results to hand-written pandas on known answers; that habit builds the judgment employers expect. IBM's augmented analytics overview describes this as human-in-the-loop augmentation rather than passive acceptance. Pair agent demos with your own small replication exercise each week so python for data analysis skill grows even when tools draft the first pass.
A Realistic Learning Timeline
Weeks 1–2: install the environment, learn minimal Python syntax, and load your first CSV in pandas. Weeks 3–6: practice filtering, grouping, joining, and handling missing values on multiple datasets until operations feel automatic. Weeks 7–8: add charts, finish a portfolio project, and optionally explore data analysis with python for a guided end-to-end example.
Progress in python for data analysis should be measured by projects completed, not hours of video watched. Most motivated learners reach productive pandas fluency in eight to twelve weeks at ten hours per week. Block recurring practice slots on your calendar the way you would for a live class—consistency beats cramming for retention and for building the muscle memory that python for data analysis interviews actually test.
Getting-Started Scorecard
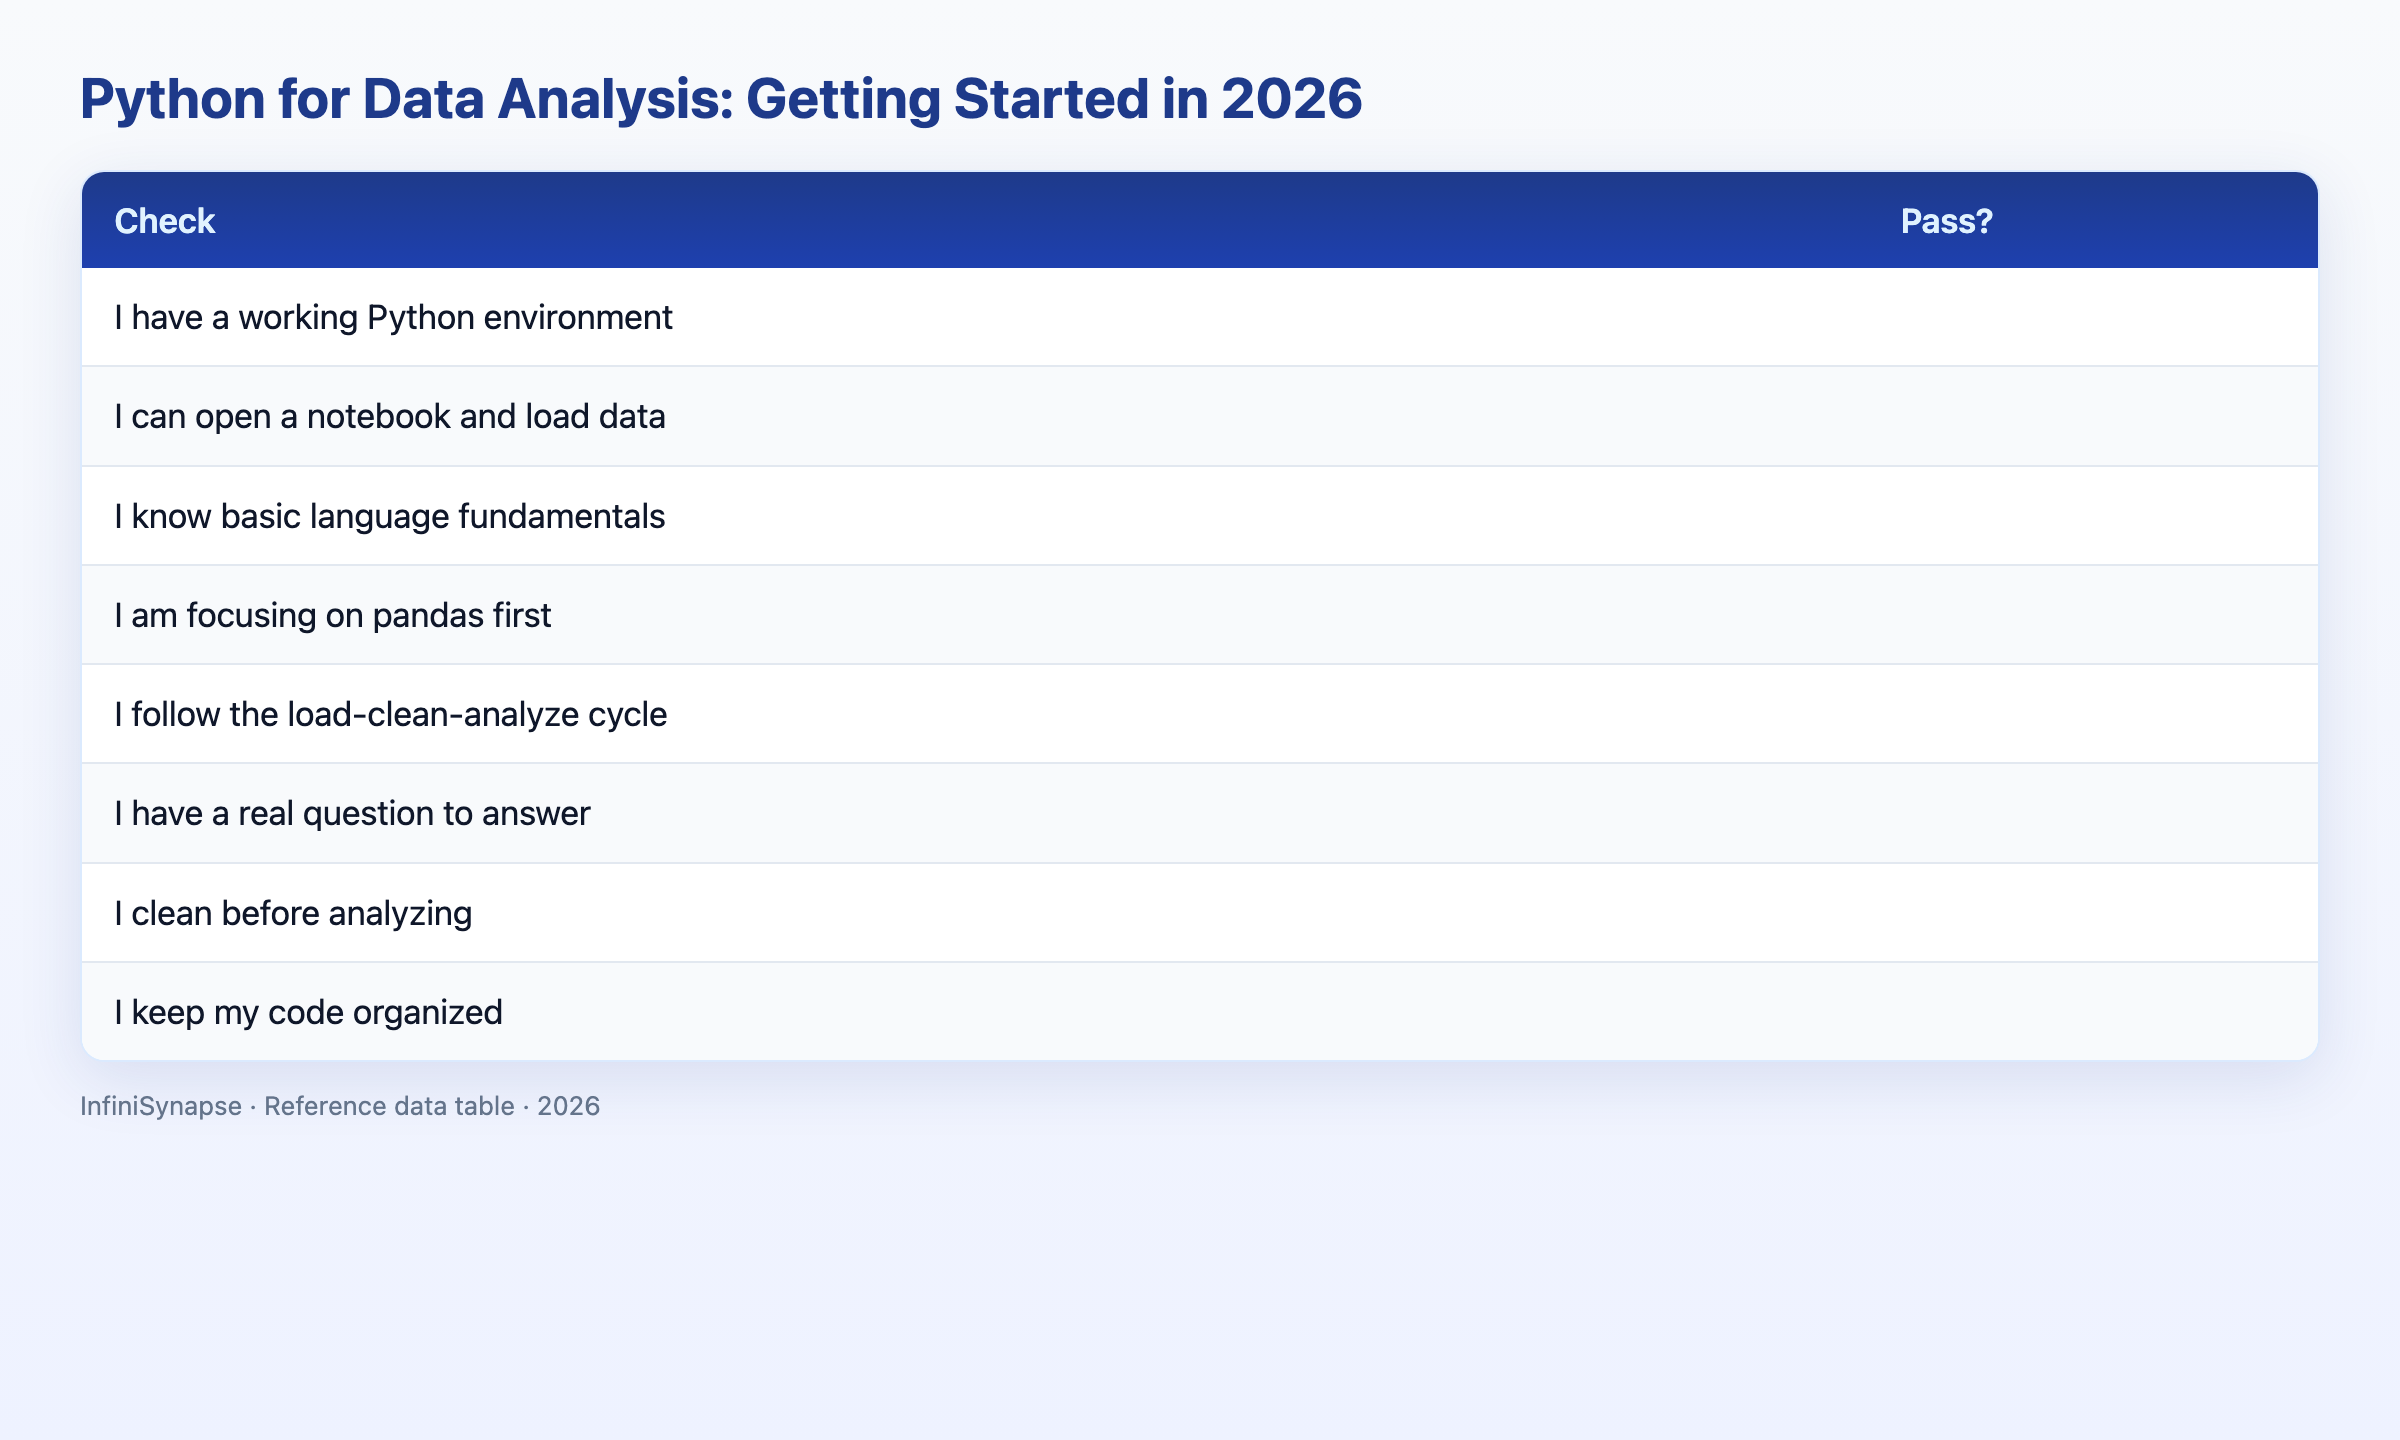
Assess readiness to practice python for data analysis (1 point each):
| Check | Pass? |
|---|---|
| I have a working Python environment | |
| I can open a notebook and load data | |
| I know basic language fundamentals | |
| I am focusing on pandas first | |
| I follow the load-clean-analyze cycle | |
| I have a real question to answer | |
| I clean before analyzing | |
| I keep notebooks organized |
6–8: ready to practice independently (~25% of beginners at week 4). 3–5: finish setup and pick a question (~50%). Below 3: install tools and run one tutorial notebook (~25%).
Frequently Asked Questions
How do I begin with analytical Python?
Install Python and Jupyter, learn minimal syntax, and focus on pandas for loading, cleaning, grouping, and joining data. Practice on a real dataset through the load-clean-analyze-visualize cycle. Add matplotlib and other libraries only when a specific project requires them.
What should I learn first?
Learn just enough Python to work with data structures, then invest heavily in pandas: load, inspect, filter, handle missing values, group, aggregate, and join. Add visualization after manipulation feels comfortable. Defer machine learning until a question truly needs it.
Is formal training worth it?
Structured courses help when you want deadlines, projects, and feedback. Free paths through official docs and public datasets work for self-starters. Either route succeeds if you finish projects and publish evidence; employers hire on demonstrated ability more than completion badges alone.
How long does training take?
Most learners need eight to twelve weeks at ten hours per week to handle everyday pandas work confidently. Timeline varies with prior programming exposure. Consistent project work beats sporadic tutorial binging for retention.
How do teams adopt analytical Python?
Teams start with one recurring report rewritten in pandas, version the notebook in Git, and pair SQL extraction with Python transformation. Success depends on shared standards for cleaning, naming, and review—not on mandating Python for every ad-hoc question.
Conclusion
Getting started with python for data analysis means a working environment, focused pandas practice, and one finished project that proves you can load, clean, analyze, and explain real data. Avoid tutorial hell, verify AI-generated code, and let each completed notebook compound into portfolio evidence.
To see how agents perform the same steps you are learning to code, read what AI-native data analysis means and try the InfiniSynapse web app free on registration, no credit card required.