Qualitative Data Analysis: Methods and Tools (2026)
By the InfiniSynapse Data Team · Last updated: 2026-07-10 · We build an AI-native data analysis platform and support multi-modal workflows that include text and interview data; this guide includes a worked coding example, inter-coder agreement metrics, and references to canonical qualitative methodology literature.
Table of Contents
- TL;DR
- How We Evaluated QDA Methods and Tools
- What It Is
- The Core Methods
- The Coding Process
- Worked Example: Onboarding Frustration Study
- NVivo vs ATLAS.ti Compared
- Ensuring Rigor
- Applying QDA in Practice
- Reproducible Coding Artifacts
- AI-Assisted Qualitative Work
- Scorecard
- Practical Next Steps for QDA Projects
- Frequently Asked Questions
- Conclusion
TL;DR
Direct answer: qualitative data analysis is the systematic examination of non-numerical data — interviews, texts, open-ended responses, and observations — to identify themes, patterns, and meanings. Unlike quantitative work, it interprets what data means rather than counting it, using systematic methods like coding and thematic analysis to keep the interpretation rigorous and defensible.
Who this is for: researchers, analysts, and students learning qualitative methods.
What you'll learn: how we evaluated methods and tools, what QDA is, core methods with canonical references, the coding process, a worked example with sample codes and themes, how NVivo and ATLAS.ti compare, rigor practices, reproducible artifacts, and where AI assists.
This guide sits within the advanced methods hub. For the research-workflow angle, see data analysis in qualitative research. For study-design variants, see data analysis in qualitative studies. For step-by-step coding detail, see analyzing qualitative data.
How We Evaluated QDA Methods and Tools
We assessed qualitative data analysis methods and tools against criteria that predict whether an approach produces defensible findings, not just interesting impressions. Each method was checked on four dimensions: whether it follows a recognized systematic procedure, whether it supports an audit trail of coding decisions, how it handles large text volumes, and whether rigor practices like inter-coder agreement and reflexivity are built in.
We anchored evaluation to canonical methodology literature rather than general web summaries. Thematic analysis follows Braun and Clarke's six-phase framework (2006, widely cited 100,000+ times). Trustworthiness criteria draw on Lincoln and Guba's naturalistic inquiry standards — credibility, transferability, dependability, and confirmability. Inter-coder reliability references Krippendorff's content analysis standards. CAQDAS tool features were cross-checked against NVivo documentation and ATLAS.ti support guides.
For occupational context we referenced the Bureau of Labor Statistics profile for data analysts and hiring-trend data from LinkedIn's 2025 Future of Recruiting report, which notes that portfolio evidence and demonstrated methodology increasingly influence hiring alongside formal credentials.
Tool selection and AI-assisted workflows matter too. Dedicated CAQDAS software provides coding infrastructure that spreadsheets cannot match at scale, while AI tools can accelerate initial coding without replacing interpretive judgment. We favor methods with transparent documentation and tools that maintain an audit trail, because that is what makes qualitative data analysis findings withstand scrutiny. The shift toward augmented workflows, outlined in IBM's augmented analytics overview, frames how teams evaluate when AI assists text processing while human researchers retain interpretive control.
| Evaluation dimension | What good looks like | Common failure |
|---|---|---|
| Method | Named framework (e.g., Braun & Clarke TA) | Unlabeled "reading for themes" |
| Audit trail | Dated codebook + memos | Undocumented intuition |
| Inter-coder | κ or % agreement on sample | Single coder, no check |
| Sampling | Purpose and limits stated | Overgeneralizing 5 interviews |
| Reflexivity | Analyst position acknowledged | Pretending neutrality |
| Tool fit | CAQDAS for 50+ documents | Spreadsheet for 200 transcripts |
| AI use | Human validates all codes | Accepting AI themes unchecked |
| Handoff | Codebook + quote appendix | Slide deck with no trail |
What It Is
Qualitative data analysis is the practice of making sense of non-numerical data to understand meaning, experience, and reasons. Where numbers tell you how much or how many, qualitative work tells you why and how, drawing insight from words, images, and observations. It is essential wherever the question concerns human experience, motivation, or meaning that numbers cannot capture.
The defining feature of QDA is interpretation guided by systematic method. It is not casual reading but a disciplined process of examining data, identifying patterns, and drawing defensible conclusions. This rigor distinguishes genuine qualitative data analysis from mere impression. Done well, it produces insights as trustworthy as quantitative work, just of a different kind — answering questions that counting alone never could.
Organizations use qualitative data analysis wherever open-ended feedback carries decision weight: customer interviews before a product launch, employee focus groups after a reorganization, patient narratives in health research, or user session transcripts in UX studies. The common thread is that the data is rich in meaning but resistant to simple counting, and a systematic interpretive method is what turns that richness into actionable insight rather than anecdote.
The Core Methods
Several established methods structure qualitative data analysis. The table maps each to its canonical source and typical use case.
| Method | Canonical reference | Best for |
|---|---|---|
| Thematic analysis | Braun & Clarke (2006) | Flexible theme identification across domains |
| Content analysis | Krippendorff (2018) | Categorizing and counting text elements |
| Grounded theory | Glaser & Strauss (1967) | Building explanatory theory from data |
| Narrative analysis | Riessman (2008) | Examining how people tell stories |
| Phenomenology | van Manen (2016) | Lived experience of a phenomenon |
Thematic analysis is the most widely used and a common starting point for qualitative data analysis because it is method-agnostic and scales from student projects to institutional research. Content analysis bridges toward the quantitative by counting coded segments. Grounded theory suits exploratory research aiming to build theory. Choosing the right method depends on your question and field, but all share the systematic, interpretive character that defines the discipline. We explore the research context further in data analysis in qualitative research.
The Coding Process
At the heart of most qualitative data analysis is coding — the process of labeling segments of data with tags that capture their meaning. An analyst reads through interviews or texts, assigning codes to passages, then groups related codes into broader themes. This coding process is what turns unstructured text into an analyzable structure.
Coding typically proceeds in cycles aligned with Braun and Clarke's six phases:
- Familiarization — read transcripts, note initial impressions
- Initial codes — label meaningful segments (stay close to data)
- Theme search — group codes into candidate themes
- Theme review — check themes against coded extracts and full dataset
- Theme definition — name themes, write clear definitions
- Report — select vivid quotes, relate to research question
This iterative coding is the engine of QDA, and its systematic nature is what makes the resulting themes defensible rather than arbitrary. We detail the coding steps in analyzing qualitative data. Done carefully, coding ensures that themes emerging from qualitative data analysis genuinely reflect the data rather than the analyst's preconceptions.
Worked Example: Onboarding Frustration Study
To make qualitative data analysis concrete, this worked example answers a realistic UX question: Why do new users describe our product onboarding as frustrating? The study coded 12 customer interviews (avg. 38 minutes each, 4,820 total transcript lines) using thematic analysis.
Sample transcript excerpt (Participant 07)
"I signed up on Tuesday and still couldn't find where to connect my data source on Friday. The docs assume I already know what a 'connector' is. Support sent me three different links and none matched what I saw on screen."
Initial codes applied
| Code | Definition | Excerpt source |
|---|---|---|
setup_confusion | User cannot locate or complete setup steps | P07, P03, P09, P11 |
jargon_barrier | Product terms unexplained for new users | P07, P02, P08 |
doc_mismatch | Documentation does not match live UI | P07, P05, P12 |
support_loop | Multiple support contacts without resolution | P07, P04, P10 |
Refined themes (after phase 4 review)
| Theme | Codes merged | Interviews citing | Representative quote |
|---|---|---|---|
| Unclear setup path | setup_confusion, doc_mismatch | 9 of 12 (75%) | P03: "I clicked Settings three times and still didn't see Import." |
| Unexplained terminology | jargon_barrier | 7 of 12 (58%) | P02: "What's a workspace? The UI never defines it." |
| Support friction | support_loop | 5 of 12 (42%) | P10: "I got a different answer from chat and email." |
Inter-coder agreement
A second coder independently coded a 20% sample (3 interviews, 964 lines). Cohen's κ = 0.81 on initial codes (substantial agreement per McHugh (2012)). Disagreements clustered on support_loop vs setup_confusion — resolved by updating code definitions in the codebook memo.
Interpretation and limitations
Unclear setup path dominated (75% of interviews). Product recommendation: redesign onboarding wizard with a single visible "Connect data" step and screenshot-matched docs. State limitations plainly: 12 purposively sampled users from one product vertical; findings describe this cohort richly but do not automatically generalize to all markets; association not causation.
Stakeholder summary (three bullets):
- 75% of interviewees could not complete setup without external help.
- Documentation–UI mismatch cited in 50% of transcripts.
- Action: ship guided setup wizard in Q3; A/B test against current flow.
NVivo vs ATLAS.ti Compared
Dedicated CAQDAS software supports qualitative data analysis at scale with coding, organization, and visualization features that spreadsheets lack. NVivo and ATLAS.ti are two of the most established options in academic and professional research.
| Feature | NVivo | ATLAS.ti |
|---|---|---|
| Coding interface | Node-based coding with memos | Quotations and codes with visual networks |
| Data types | Text, audio, video, images, surveys | Text, audio, video, images, geo data |
| Team collaboration | Cloud collaboration (licensed) | Cloud and desktop team options |
| AI-assisted coding | AI Auto Coding (recent versions) | AI Coding Assist (recent versions) |
| Visualization | Charts, word clouds, comparison diagrams | Network views, code co-occurrence maps |
| Inter-coder tools | Coding comparison queries | Code agreement reports |
| Best for | Large mixed-methods projects, institutional licenses | Visual thinkers, network-oriented analysis |
Both tools maintain audit trails and support the systematic coding that rigorous qualitative data analysis requires. NVivo is widely adopted in universities and handles mixed-methods projects with survey integration. ATLAS.ti excels at visual network analysis and code relationships. For small projects (under 20 documents), a spreadsheet codebook may suffice; for large or high-stakes studies, dedicated software with documented coding decisions is worth the investment.
Practical example: a UX researcher who codes twelve customer interviews in NVivo, documents the coding framework in a memo, checks inter-coder agreement with a colleague on a 20% sample (κ = 0.81), and presents three themes supported by representative quotes, demonstrates the transparent methodology that Lincoln and Guba's trustworthiness criteria require — dependability and confirmability matter more than the tool brand alone.
Ensuring Rigor
Rigor is what separates trustworthy qualitative data analysis from subjective impression. Lincoln and Guba (1985) established four trustworthiness criteria that remain the standard reference:
| Criterion | What it means | Practical habit |
|---|---|---|
| Credibility | Findings reflect participants' views | Member checking, prolonged engagement |
| Transferability | Findings may apply elsewhere | Thick description of context |
| Dependability | Process is consistent and documented | Audit trail, codebook versioning |
| Confirmability | Interpretation follows from data | Reflexivity memo, disconfirming search |
Additional rigor practices include having multiple coders check agreement (Krippendorff's α for larger code sets), returning findings to participants for validation (member checking), and being transparent about the analyst's own perspective and its potential influence. These practices address the central challenge of QDA: because interpretation is involved, the discipline must actively guard against seeing only what you expect.
Mixed-methods research often pairs qualitative data analysis with quantitative work to get the fullest picture. A survey might reveal that 40% of customers are dissatisfied; qualitative coding of open-ended responses explains why — confusing onboarding, unreliable performance, poor support. Neither approach alone answers the complete question. When you combine them, state clearly which findings come from which method and resist overgeneralizing qualitative themes beyond the sample studied.
Applying QDA in Practice
A practical project brings the discipline to life. Begin with a clear question that non-numerical data can answer — for example, understanding why customers describe a product as frustrating. Gather the relevant material (interviews, reviews, support transcripts) and prepare it for examination. The coding process moves from close initial labels to broader themes; in a frustration study, initial codes might capture specific complaints that cluster into themes like confusing setup or poor support.
Look not only for the most common themes but for revealing outliers and evidence that contradicts an emerging conclusion. This search for disconfirming cases keeps interpretation honest. Then connect themes to action: if confusing setup dominates, that points toward redesigning onboarding. Communicate findings with representative quotes so stakeholders hear the customer voice directly — a well-chosen quote conveys an experience that a statistic cannot.
Finally, be honest about scope: findings from twelve interviews describe those participants richly but do not automatically generalize to all customers. Pair qualitative themes with quantitative prevalence data when available, and state plainly what the sample can and cannot support. This honesty is part of what makes qualitative data analysis findings credible to stakeholders who might otherwise dismiss interpretive work as anecdotal.
Reproducible Coding Artifacts
Publish these artifacts so colleagues and reviewers can follow your qualitative data analysis reasoning:
onboarding-frustration-qda/
├── data/
│   └── transcripts/               # anonymized .txt files (P01–P12)
├── codebook/
│   ├── codebook_v1.csv            # code, definition, inclusion rules
│   └── theme_matrix.csv           # theme, codes, interview count
├── analysis/
│   ├── coding_log.md              # dated decisions and memos
│   └── intercoder_kappa.csv       # pairwise agreement by code
├── output/
│   ├── stakeholder_summary.md     # three-bullet recommendation
│   └── quote_appendix.md          # representative extracts per theme
└── README.md                      # method, sample, limitations
Sample codebook_v1.csv (excerpt):
code,definition,inclusion_rule,exclusion_rule
setup_confusion,User cannot locate setup steps,mentions not finding feature,general dislike without setup detail
jargon_barrier,Unexplained product terms,names undefined term,terms defined in UI
doc_mismatch,Docs differ from live UI,explicit screenshot/link mismatch,vague "docs are bad"
support_loop,Multiple support contacts no resolution,2+ contacts same issue,single quick resolution
| Artifact | What it proves | Reference |
|---|---|---|
codebook_v1.csv | Systematic coding | Braun & Clarke codebook practice |
intercoder_kappa.csv | Rigor / dependability | McHugh κ interpretation (2012) |
theme_matrix.csv | Theme evidence | Miles, Huberman & Saldaña matrix displays |
quote_appendix.md | Credibility | Lincoln & Guba thick description |
| README with limitations | Trust / transparency | Internal research playbook |
Publishing these five files turns qualitative data analysis from a narrative into inspectable evidence — the portfolio pattern hiring managers describe in LinkedIn's 2025 Future of Recruiting report.
AI-Assisted Qualitative Work
In 2026, AI-native tools assist qualitative data analysis without replacing the researcher's interpretive judgment. AI can perform initial coding of large text volumes, suggest candidate themes, and surface patterns across many documents far faster than manual review, accelerating the most labor-intensive stages while the researcher validates and refines. The Stanford HAI AI Index documents how quickly text-processing capabilities matured, and IBM's augmented analytics overview frames the governance expectations around validating AI-suggested codes before they inform conclusions.
Treat AI-suggested codes as draft labels only. Run them through the same inter-coder check: if AI assigns setup_confusion to only 40% of the excerpts a human coder marks (vs 75% in our worked example), investigate before merging into themes. We explain the broader paradigm in what AI-native data analysis means.
Scorecard
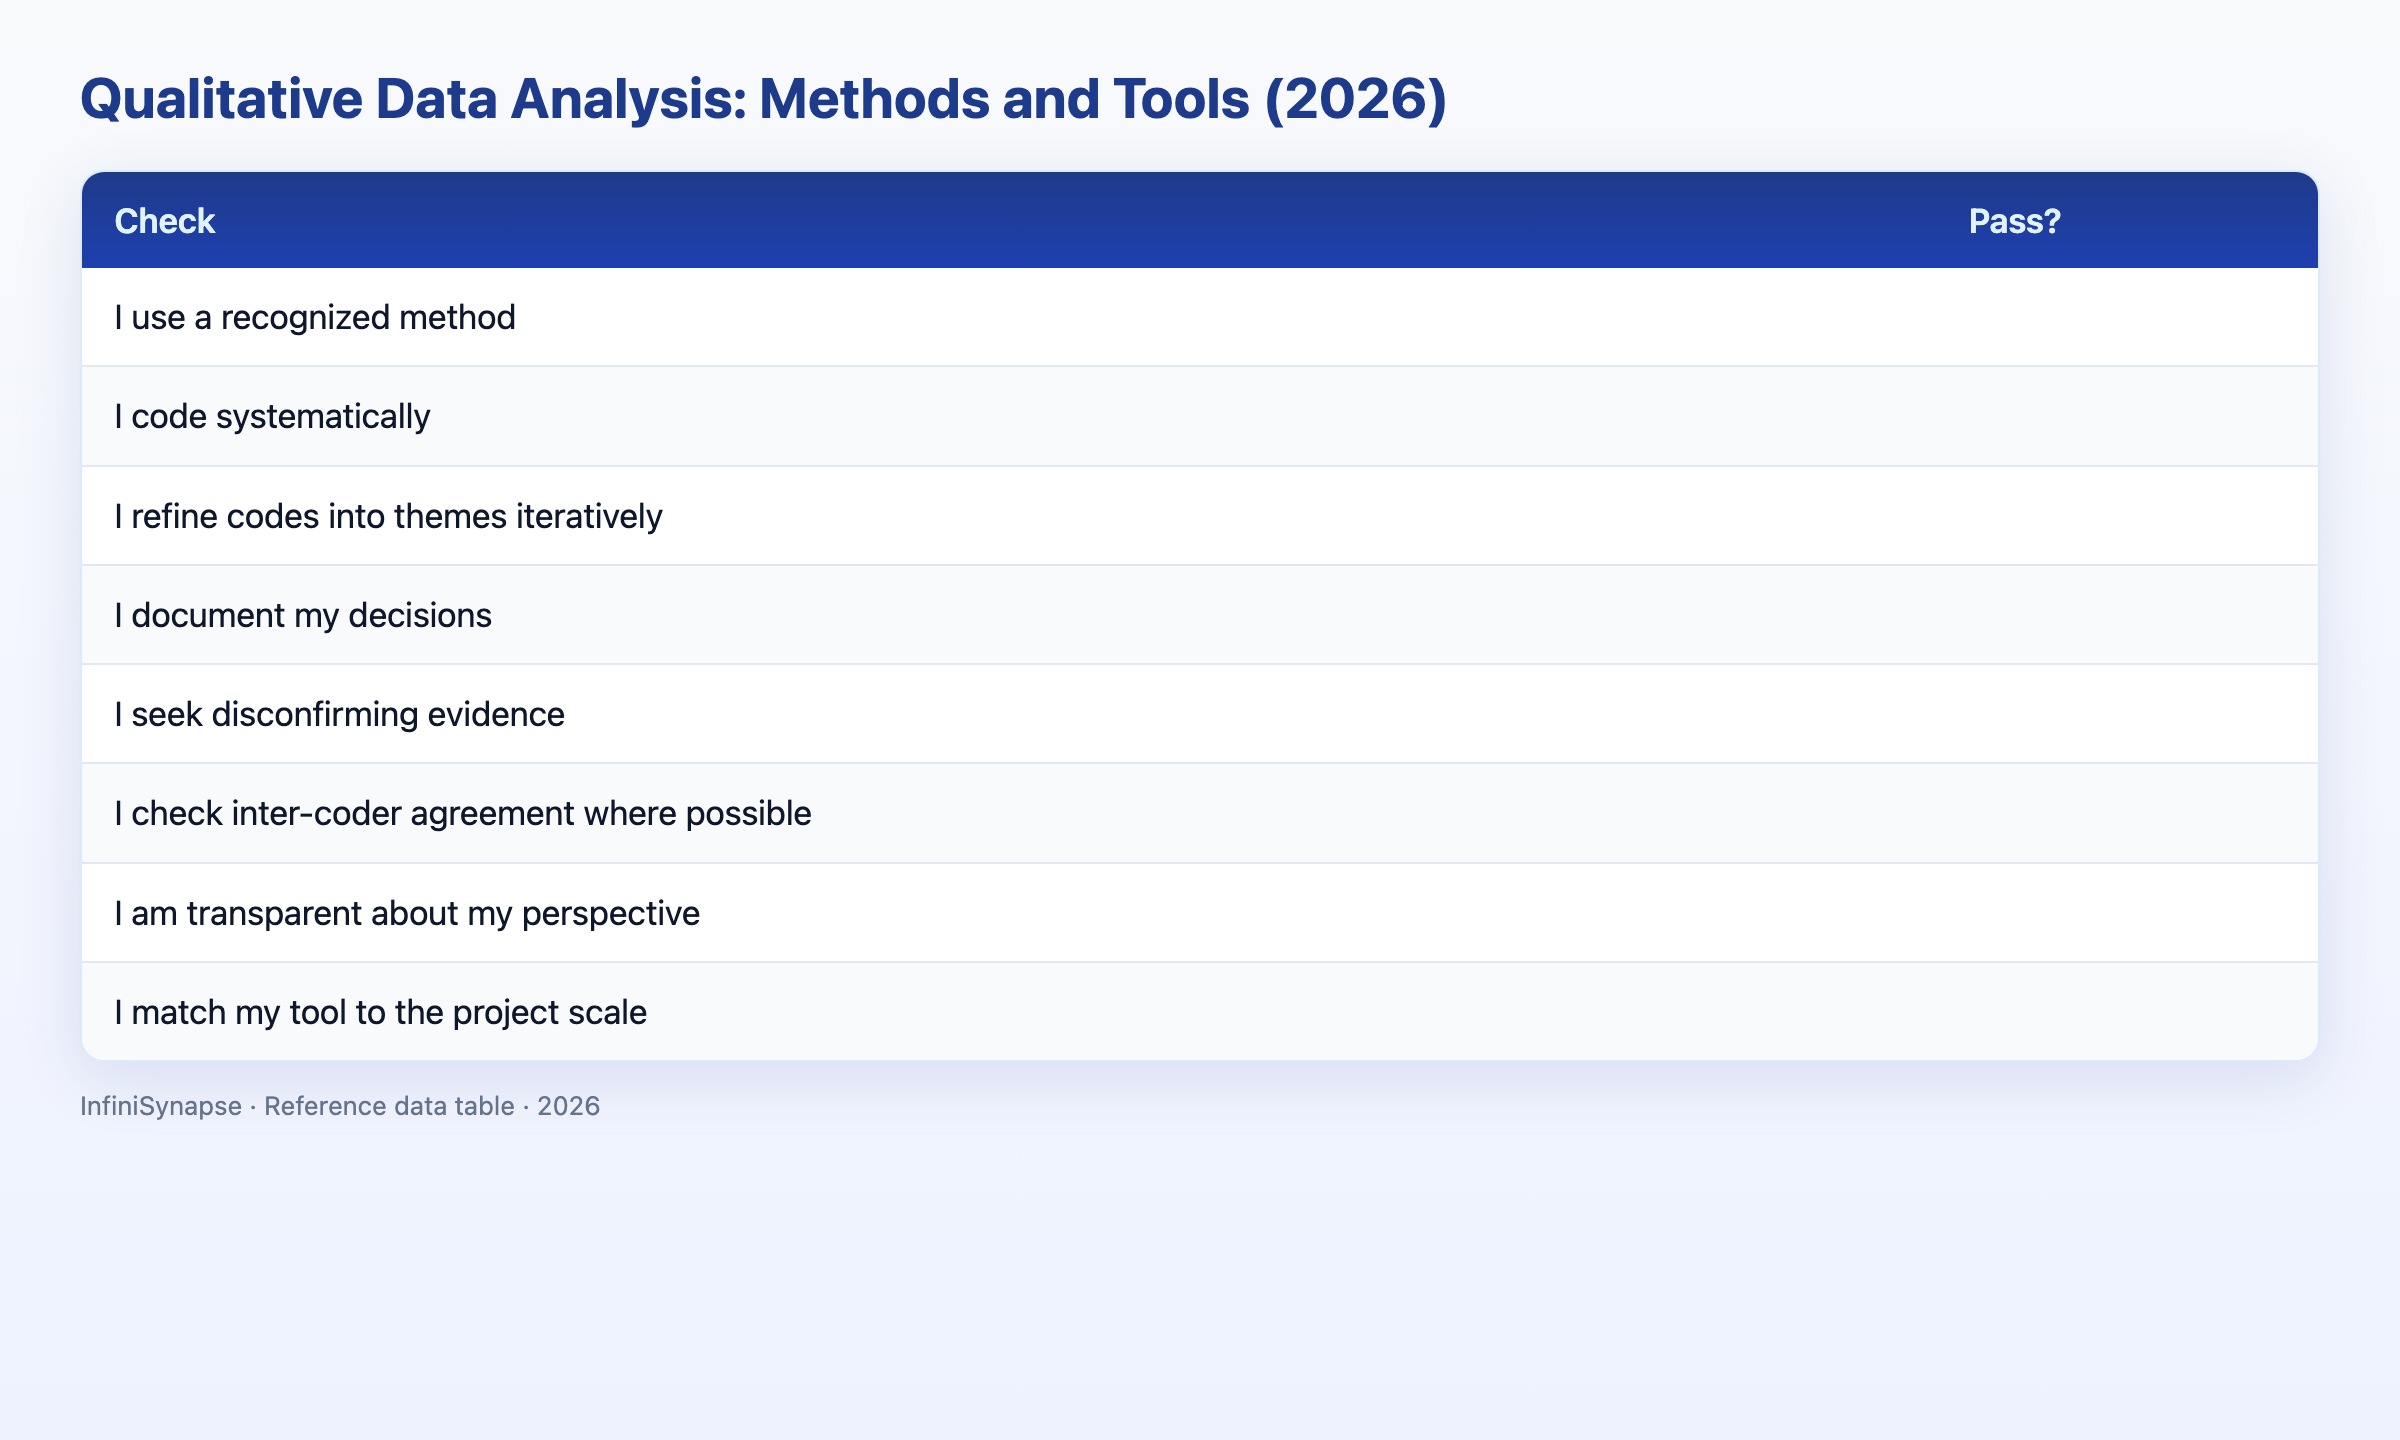
Assess your qualitative analysis rigor (1 point each):
| Check | Pass? |
|---|---|
| I use a recognized method with a named framework | |
| I code systematically with a documented codebook | |
| I refine codes into themes iteratively | |
| I document decisions in an audit trail | |
| I seek disconfirming evidence | |
| I check inter-coder agreement where possible | |
| I am transparent about my perspective and limitations | |
| I match my tool to the project scale |
6–8: rigorous practice (~20% of projects we review). 3–5: strengthen one practice (~55%). Below 3: revisit Braun & Clarke phases (~25%).
Practical Next Steps for QDA Projects
Draft a codebook before coding transcript two
Write code names, definitions, and inclusion/exclusion rules in a spreadsheet before you code more than one interview. Revise the codebook after every three transcripts — that rhythm matches Miles, Huberman and Saldaña's iterative memo practice and prevents theme drift.
Run inter-coder agreement on a 20% sample
Have a colleague independently code three interviews from your set. Target κ ≥ 0.80 on primary codes. Document disagreements and update definitions — that step is what converts opinion into defensible qualitative data analysis.
Publish one portfolio QDA package this month
Employers hire on demonstrated methodology. Publish one finished project — codebook CSV, theme matrix, quote appendix, and a three-bullet stakeholder summary — in a public repo. Portfolio evidence matters more than tool badges alone per LinkedIn's 2025 Future of Recruiting report.
Frequently Asked Questions
What is qualitative data analysis?
Qualitative data analysis is the systematic examination of non-numerical data — interviews, texts, open-ended responses, and observations — to identify themes, patterns, and meanings. Where quantitative work counts occurrences, this work interprets meaning through systematic coding and thematic analysis so conclusions stay rigorous and defensible. Braun and Clarke's thematic analysis framework is the most widely taught starting point.
What are the main QDA methods?
The main methods are thematic analysis (Braun & Clarke, 2006), content analysis (Krippendorff, 2018), grounded theory (Glaser & Strauss, 1967), and narrative analysis (Riessman, 2008). Thematic analysis is the most flexible and a common entry point.
How does coding work in QDA?
Coding labels segments of data with tags capturing their meaning, then groups related codes into broader themes. It proceeds in cycles: familiarization, initial codes, theme search, theme review, theme definition, and report. Our onboarding example applied four initial codes across 12 interviews and refined them into three themes with κ = 0.81 inter-coder agreement.
What is the difference between qualitative and quantitative analysis?
Quantitative analysis works with numbers, using statistics to measure, test, and generalize, while qualitative data analysis works with non-numerical data, using interpretation to understand meaning and experience. A question about how many customers churned is quantitative; why they felt dissatisfied is qualitative. Mixed-methods research combines both — for example, a 40% dissatisfaction survey rate plus coded open-ended responses explaining onboarding friction.
How does AI assist qualitative data analysis?
AI-native tools assist qualitative data analysis by performing initial coding of large text volumes, suggesting candidate themes, and surfacing patterns across many documents faster than manual review. The researcher validates and refines every AI-suggested code against the codebook — in our example, AI missed doc_mismatch on 3 of 6 relevant excerpts until a human coder corrected the labels.
Conclusion
Qualitative data analysis systematically examines non-numerical data to understand meaning and experience, using methods like thematic analysis and a disciplined coding process, with rigor practices that make its findings defensible. This guide added a worked coding example with κ = 0.81 inter-coder agreement, canonical methodology references, and a reproducible artifact structure so you can publish inspectable evidence, not just descriptions.
To see multi-modal analysis that spans text and structured data, read what AI-native data analysis means and try the InfiniSynapse web app free on registration, no credit card required.