R for Data Analysis in 2026: When It Wins
By the InfiniSynapse Data Team · Last updated: 2026-07-09 · We build an AI-native data analysis platform and work alongside R in research and statistical projects; this guide reflects where R genuinely excels and how it compares to Python.
Table of Contents
- TL;DR
- How We Evaluated R for Analysis
- What R Is Built For
- The Core Packages
- R vs Python Compared
- When R Wins
- Getting Started With R
- Common Pitfalls
- AI-Assisted Statistical Workflows
- R Scorecard
- Practical Next Steps
- Frequently Asked Questions
- Conclusion
TL;DR
Direct answer: r data analysis uses the R language and its statistical packages to analyze data, excelling at statistics, modeling, and publication-quality visualization. R has deep roots in academia and research, where its statistical depth and reproducibility shine. It overlaps heavily with Python, and the choice often comes down to your field and existing skills.
Who this is for: anyone considering R analysis or weighing it against Python.
What you'll learn: how we evaluated R, what it is built for, core packages, a named R vs Python comparison, when R wins, and how to start.
This guide sits within the advanced methods hub; for the Python comparison in the other direction, see python for analysis. For related depth in this pillar, see SQL Data Analysis: Patterns and Queries.
How We Evaluated R for Analysis
We assessed r data analysis against criteria that predict whether R delivers value in real statistical workflows, not tutorial exercises alone. Each dimension was checked on four axes: statistical depth for hypothesis testing and modeling, visualization quality for publication-ready output, reproducibility through scripted pipelines, and how well R fits the communities and job postings in fields that still favor it. We cross-referenced these skills with the disciplined process described in the Wikipedia overview of data analysis and the language foundations in the Wikipedia R overview.
How We Evaluated R: In Practice
Tool overlap and AI-assisted workflows matter too. R and Python both handle most analytical tasks, but they emphasize different strengths, and an AI agent can now handle routine preparation while R focuses on specialized statistics. We favor honest comparison over brand loyalty, because choosing r data analysis when your field and question demand statistical depth delivers more value than defaulting to a general-purpose language out of habit. The shift toward augmented workflows, outlined in IBM's augmented analytics overview, frames how teams combine agent-assisted preparation with rigorous statistical modeling in R.## What R Is Built For R data analysis was designed from the ground up for statistics, and that origin shapes everything about it. Created by statisticians for statistical computing, R treats data, models, and statistical procedures as first-class citizens, making analysis exceptionally natural for anyone whose work centers on rigorous quantitative methods. Where general-purpose languages bolt statistics on through libraries, R has it in its bones.
What R Is Built: In Practice
This statistical focus makes r data analysis the lingua franca of academic research and many quantitative fields. Its comprehensive package ecosystem covers virtually every statistical method, from classical tests to cutting-edge techniques, often implemented by the researchers who developed them. For work where rigorous, documented statistics matter most, R is a natural home rather than a niche alternative.## The Core Packages
The power of r data analysis comes from its packages. The tidyverse — a collection including dplyr for data manipulation and ggplot2 for visualization — has transformed R into a coherent, readable workflow. dplyr handles the filtering, grouping, and joining that most analysis requires, while ggplot2 produces the publication-quality graphics R is renowned for.
Beyond the tidyverse, r data analysis draws on thousands of specialized packages for specific statistical methods. Whatever technique a question requires, there is likely an R package for it, often maintained by domain experts. Learning the tidyverse first gives you a solid foundation, and you add specialized packages as specific analytical needs arise — the same focused-learning approach that works well across analytical tools.
R vs Python Compared
The perennial question in r data analysis is how it compares to Python. Both are free, powerful, and capable of the full analytical workflow. The differences are ones of emphasis: R has deeper statistical roots and produces exceptional statistical graphics, while Python is more general-purpose and dominant in industry and machine learning.
| Dimension | R | Python |
|---|---|---|
| Statistical depth | Unmatched package ecosystem for specialized methods | Strong via SciPy, statsmodels, scikit-learn |
| Visualization | ggplot2 sets the research standard | matplotlib, seaborn, Plotly — versatile |
| Industry adoption | Academia, biostatistics, social sciences | Tech, engineering, ML engineering |
| Learning curve | Tidyverse simplifies; base R has quirks | Readable syntax; pandas is the core skill |
| Reproducibility | R Markdown, knitr — research-native | Jupyter notebooks, widely used |
| Machine learning | caret, tidymodels; smaller ML community | scikit-learn, PyTorch — industry default |
In practice, the choice between r data analysis and Python often comes down to your field and community. Academia, biostatistics, and social sciences lean toward R, while industry, engineering, and machine learning lean toward Python. Neither is objectively better; each excels in its domain. If your work is heavily statistical and your field favors R, it is the natural choice; if you need general-purpose flexibility and industry alignment, Python may fit better, as covered in python for analysis.
Practical example: a biostatistician who completes a survival analysis in R with the survival package, documents assumptions in an R Markdown report, and shares reproducible code alongside publication-quality Kaplan-Meier plots, demonstrates the combination of statistical depth and reproducibility that Harvard Business Review's skills-based hiring research describes as increasingly decisive — demonstrated ability and transparent methodology matter more than which language logo appears on a résumé.
When R Wins
R data analysis wins decisively in several situations. For heavy statistical work — hypothesis testing, advanced regression, specialized statistical models — R offers unmatched depth and the confidence that methods are correctly implemented by experts. For publication-quality visualization, ggplot2 produces graphics that set the standard in research.
R also wins where your field and collaborators already use it, since sharing code and reproducing analyses is smoother within a common ecosystem. In academic research especially, R is often the expected tool, making it the pragmatic choice regardless of personal preference. Recognizing when r data analysis wins, and when Python or another tool would serve better, is part of choosing tools wisely rather than defaulting to one for every task.
R wins less decisively for general data engineering, production ML pipelines, and roles where Python is the team standard. In those contexts, forcing R creates friction without adding statistical depth the role requires. The honest assessment is that r data analysis is superb for statistics and research graphics, and matching it to those strengths is where it delivers the most value. Analysts who know both languages often use Python for data wrangling and deployment, then export prepared datasets to R for specialized modeling — a hybrid workflow that plays to each tool's strengths.
Getting Started With R
Getting started with r data analysis follows a familiar path. Install R and the RStudio environment, which provides an excellent interface, then learn the basics of the language and dive into the tidyverse. Focusing on dplyr for manipulation and ggplot2 for visualization gives you the core of practical R quickly.
The best way to learn is to practice on real questions rather than isolated exercises. Work through the load-clean-analyze-visualize cycle on data you care about, adding statistical methods as your questions require them. The R community is welcoming and academic, with abundant resources at every level. Starting with the tidyverse and building toward specialized statistical packages is the efficient path into r data analysis.
R Markdown deserves mention as a learning accelerator. It combines code, output, and narrative in a single document, which mirrors how research actually gets communicated. Building your first analysis as an R Markdown report teaches both the language and the reproducibility habit that makes r data analysis valuable in collaborative settings. Share the rendered report alongside your code, and reviewers can see exactly how you arrived at each figure and table.
Common Pitfalls
Several pitfalls affect those learning r data analysis. The first is being overwhelmed by R's flexibility and multiple ways of doing things; focusing on the tidyverse provides a coherent approach that avoids this confusion. The second is neglecting data cleaning, which undermines analysis just as it does any analytical approach.
A third pitfall is reaching for advanced statistical methods without understanding their assumptions, producing precise but invalid results. R makes sophisticated methods easy to apply, which is a strength that becomes a hazard without statistical understanding. A fourth is writing disorganized code that sacrifices the reproducibility that makes r data analysis valuable in research. Avoiding these pitfalls — tidyverse focus, diligent cleaning, understanding methods, organized code — makes the path far smoother.
AI-Assisted Statistical Workflows
In 2026, r data analysis coexists with AI-native tools that handle routine preparation, letting R focus on specialized statistical work where it excels. An agent can produce initial summaries and clean datasets from plain-language goals, reserving R for rigorous modeling, assumption checking, and publication-ready output. The Stanford HAI AI Index documents how quickly agent-assisted analysis matured, and IBM's augmented analytics overview frames the governance expectations around validating automated outputs before they feed into statistical models. We explain the broader paradigm in what AI-native data analysis means.
Building statistical depth is what unlocks R's full value. R makes advanced methods easy to call, which becomes a hazard without understanding the statistics behind the functions. A practical path pairs language learning with statistical learning: start with descriptive summaries, move to inferential tests, then to regression and specialized models, studying the assumptions of each as you go. Because r data analysis implements virtually every statistical method, it is an ideal environment for this progression — whatever technique you study next, R almost certainly supports it, often through a package written by the method's originators.
R Scorecard
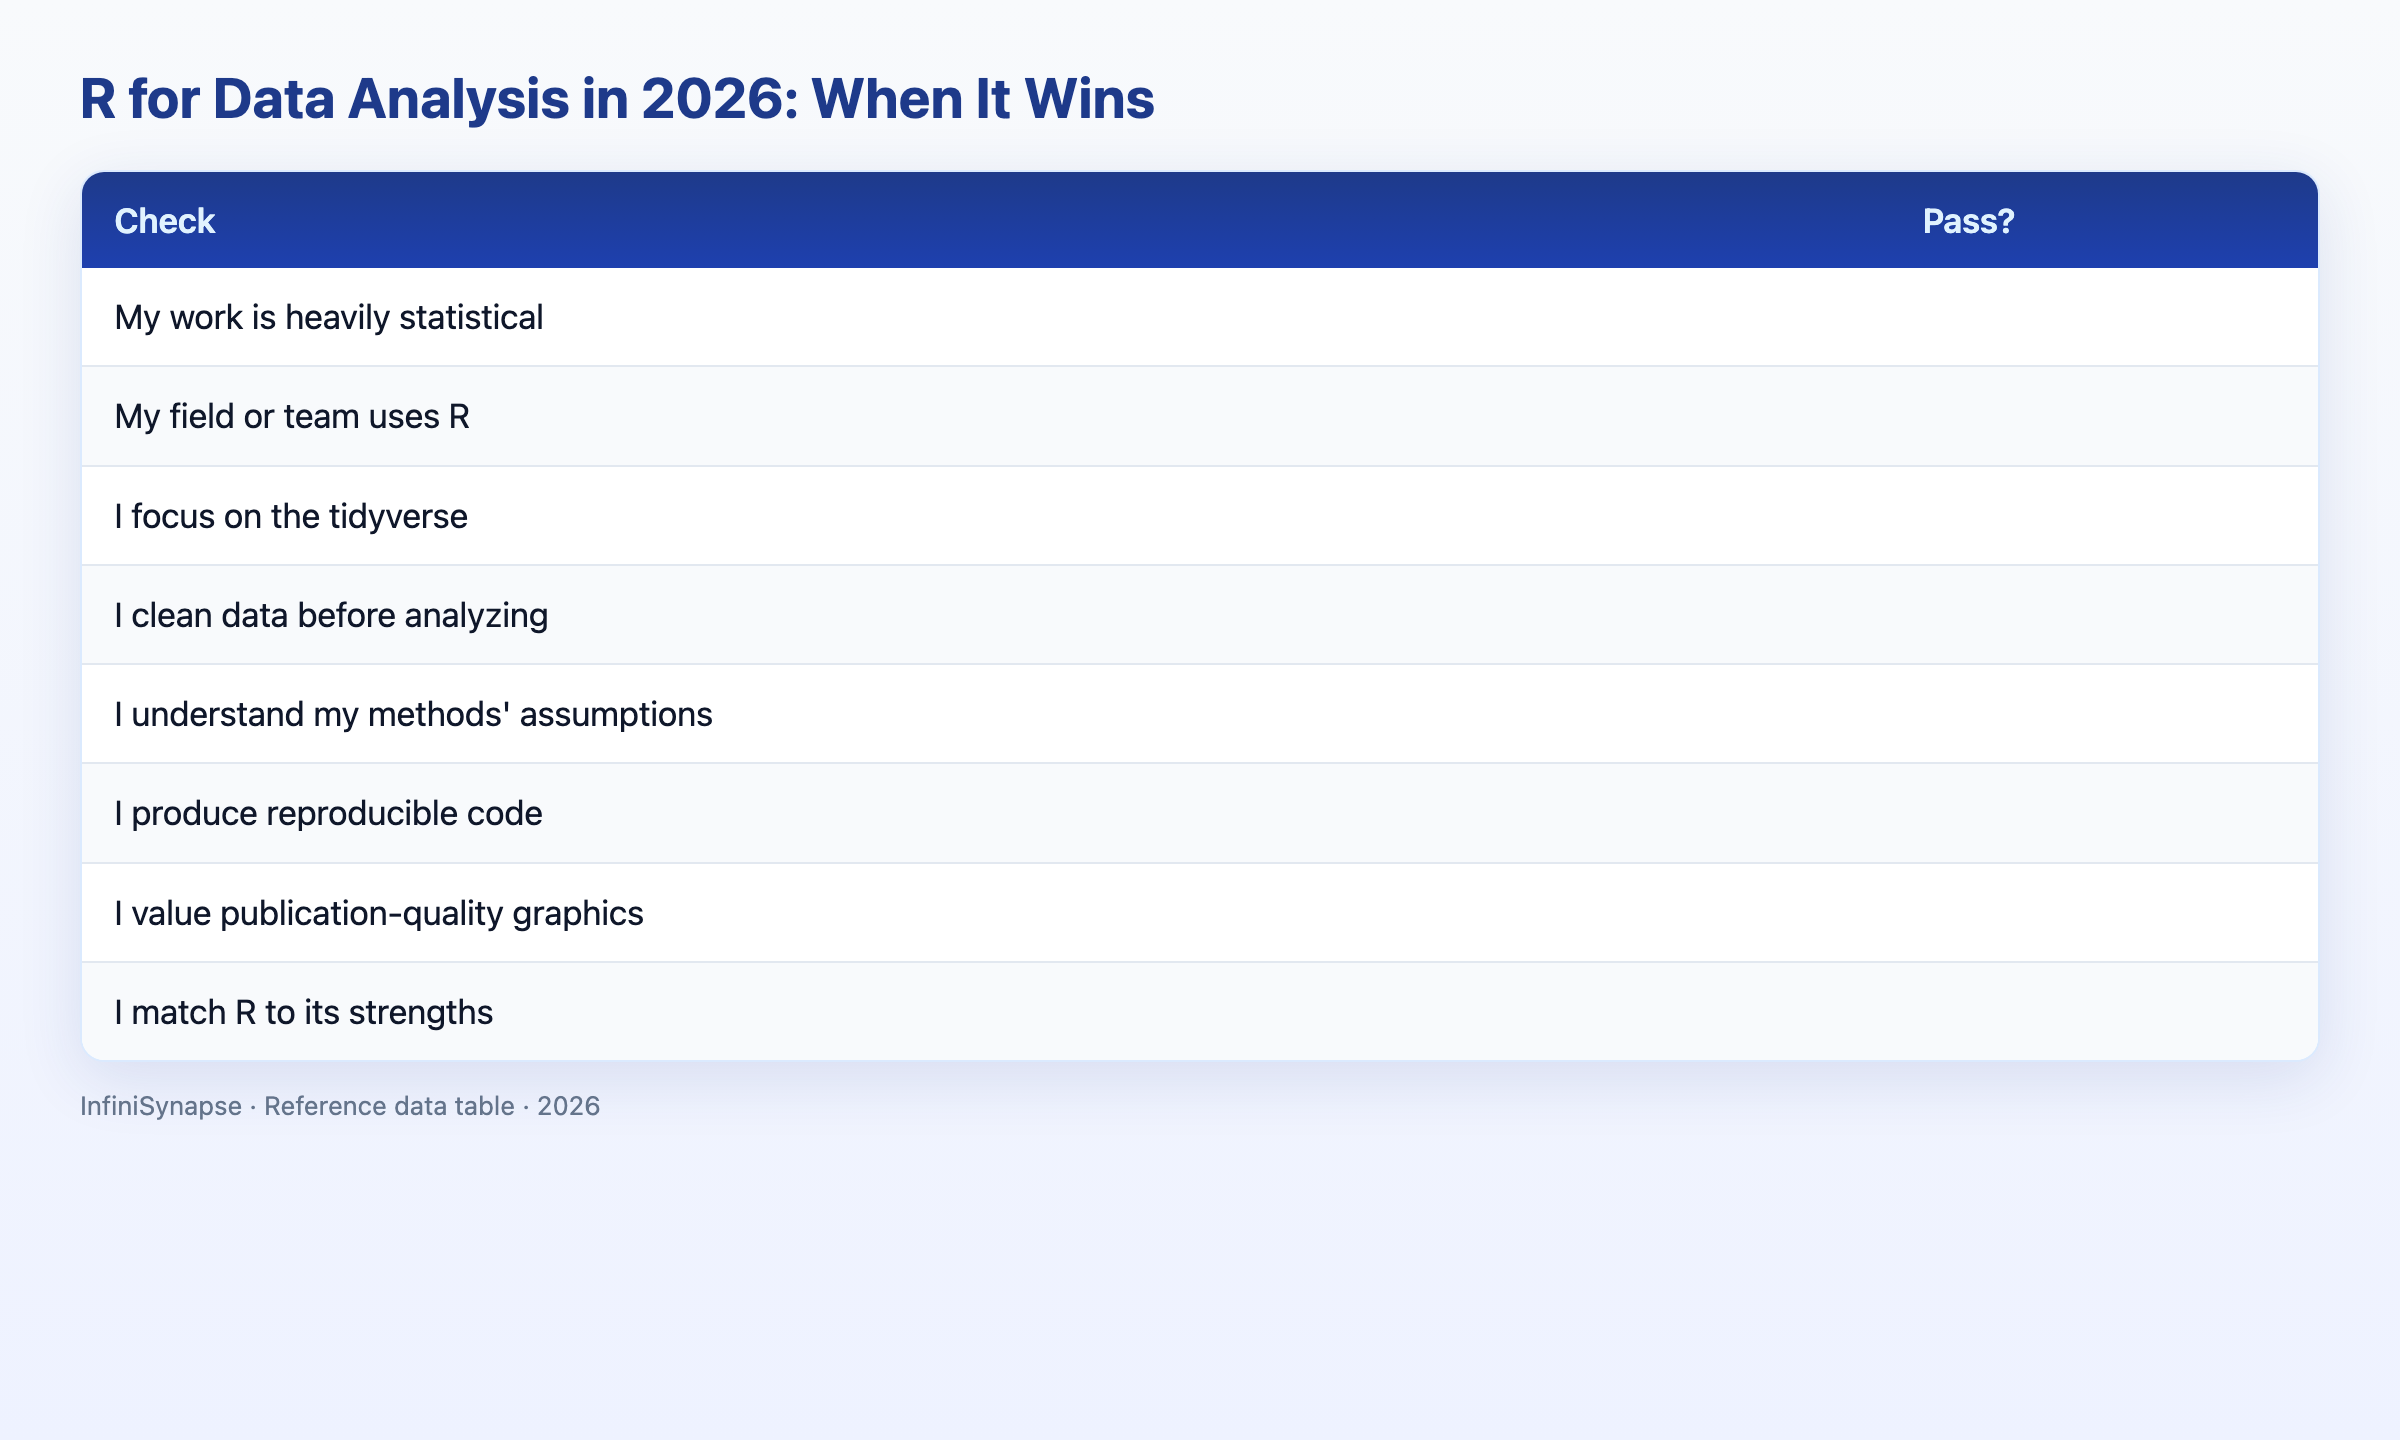
Assess your R analysis approach (1 point each):
| Check | Pass? |
|---|---|
| My work is heavily statistical | |
| My field or team uses R | |
| I focus on the tidyverse | |
| I clean data before analyzing | |
| I understand my methods' assumptions | |
| I produce reproducible code | |
| I value publication-quality graphics | |
| I match R to its strengths |
6–8: R is a strong fit. 3–5: consider whether R or Python suits better. Below 3: Python may fit your needs.
Practical Next Steps
Verify against real job postings
Before committing time or budget, pull five recent job postings in your target market and list the SQL, visualization, and communication skills each repeats. Align your learning plan to those patterns rather than a generic syllabus.
Ship one portfolio artifact this month
Employers hire on demonstrated ability. Publish one finished analysis — with a clear question, reproducible queries, and a short executive summary — alongside any credential or course completion.
Frequently Asked Questions
What is R data analysis?
R data analysis uses the R programming language and its statistical packages to analyze data, excelling at statistics, modeling, and publication-quality visualization. Created by statisticians for statistical computing, R has deep roots in academia and research, where its statistical depth, comprehensive package ecosystem, and reproducibility make it a natural choice.
Is R or Python better for analysis?
Neither is objectively better; R and Python overlap heavily and differ in emphasis. R has deeper statistical roots and produces exceptional statistical graphics, favored in academia and biostatistics, while Python is more general-purpose and dominant in industry and machine learning. The choice often comes down to your field and existing skills.
What packages are used for R data analysis?
R data analysis relies on the tidyverse, including dplyr for data manipulation and ggplot2 for visualization, plus thousands of specialized packages covering virtually every statistical method. The tidyverse provides a coherent, readable workflow, while specialized packages give R unmatched statistical depth.
When should I choose R for analysis?
Choose r data analysis for heavy statistical work like hypothesis testing and advanced modeling, for publication-quality visualization with ggplot2, and when your field or collaborators already use R. Academia, biostatistics, and social sciences favor R, making it the pragmatic choice there for smooth collaboration and reproducibility.
How does R work with AI-native tools?
R data analysis coexists with AI-native tools that handle routine preparation, letting R focus on specialized statistics. An analyst might use an agent for routine data preparation and summary, then bring the prepared data into R for rigorous modeling, combining the agent's speed on routine work with R's depth on sophisticated methods.
Conclusion
R data analysis is the statistician's choice, excelling at rigorous statistics, specialized methods, and publication-quality graphics, with deep roots in academia and research. It overlaps with Python, and the choice comes down to your field and needs. In 2026, R pairs well with AI-native agents that handle routine work while R does the specialized statistics.
To see how agents complement specialized tools, read what AI-native data analysis means and try the InfiniSynapse web app free on registration, no credit card required.