Spatial Data Analysis: A 2026 Guide
By the InfiniSynapse Data Team · Last updated: 2026-07-09 · We build an AI-native data analysis platform and evaluate geographic methods against how location data is actually used in production workflows.
Table of Contents
- TL;DR
- How We Evaluated Spatial Methods
- What Location Adds to Analysis
- Core Methods and When to Use Them
- Tools Compared
- Common Applications
- A Practical Site-Selection Example
- Pitfalls That Invalidate Results
- AI and Spatial Work in 2026
- Spatial Analysis Scorecard
- Practical Next Steps
- Frequently Asked Questions
- Conclusion
TL;DR
Direct answer: spatial data analysis examines data tied to places — coordinates, addresses, regions — to find patterns that ordinary statistics miss because nearby locations tend to resemble each other. It combines mapping, spatial statistics, and geographic processing through tools like GeoPandas and QGIS to answer where questions that shape business, public health, and environmental decisions.
Who this is for: analysts learning spatial data analysis or working with location-tagged datasets for the first time.
What you'll learn: how we evaluated spatial methods, what location adds to analysis, core methods and tools, a practical site-selection walkthrough, common pitfalls, and how AI-native workflows fit in.
This guide sits within the advanced methods hub. For related depth in this pillar, see Topological Data Analysis, Made Practical and Survey Data Analysis. For the broader technique landscape, see data analysis techniques.
How We Evaluated Spatial Methods
We selected methods and tools for this guide using criteria that mirror how geographic analysts actually work in 2026, not GIS brand prestige alone. Each approach was checked against four dimensions: whether it accounts for spatial dependence rather than assuming independent observations, whether outputs are reproducible in code or documented workflows, whether the method fits the scale of the data (point, polygon, raster), and whether results can be communicated clearly on a map without misleading design choices.
How We Evaluated Spatial: What To Verify
We cross-referenced these criteria with the EPA Geographic Information Systems overview, which outlines how federal environmental programs treat location as a first-class data dimension, and with the general analytical process in the Wikipedia data analysis overview. Spatial dependence — the principle that nearby observations correlate — is formalized in geographic literature and underpins every legitimate spatial data analysis workflow; ignoring it produces the same class of invalid inference that standard textbooks warn against for misspecified models.
How We Evaluated Spatial: In Practice
Tool accessibility and auditability matter too. A spatial data analysis pipeline you cannot rerun or explain to a stakeholder delivers less value than a simpler map built from a transparent script. We favor methods with public documentation, open libraries where possible, and curricula aligned with what employers list — SQL for joining location tables, a GIS or geospatial library for geometry operations, and basic spatial statistics for testing patterns. Enterprise teams increasingly pair these foundations with governed AI-assisted workflows described in IBM's augmented analytics overview, while the Stanford HAI AI Index tracks how quickly agent-assisted querying moved from pilot to production roles.## What Location Adds to Analysis
Location fundamentally changes what valid analysis looks like. When each record carries coordinates or belongs to a region, patterns often cluster in space: retail sales concentrate near transit, pollution follows wind corridors, disease cases cluster where people live and work. Standard methods that treat every row as independent can overstate confidence and misread correlation as causation when the real driver is shared geography.
Spatial data analysis treats place as a meaningful dimension. Instead of asking only how sales vary by product, you ask how they vary by neighborhood and whether adjacent stores move together. That shift requires specialized methods — spatial autocorrelation, spatial regression, kernel density estimation — but the conceptual payoff is large: you answer questions that flat tables cannot support.
The EPA GIS program illustrates why this discipline persists across domains. Environmental monitoring, facility siting, and exposure assessment all depend on overlaying layers — emissions sources, population density, land use — and testing whether observed patterns exceed random clustering. Business analysts face parallel questions when choosing store locations or drawing sales territories. In every case, spatial data analysis is the bridge between raw coordinates and decisions that depend on where.
Core Methods and When to Use Them
Effective spatial data analysis starts with method selection matched to geometry type and question. Mapping and choropleth visualization reveal patterns quickly but require careful normalization — rates, not raw counts — to avoid population bias. Spatial clustering methods such as Getis-Ord Gi* hot-spot analysis identify where high or low values concentrate relative to neighbors.
Spatial autocorrelation statistics, including Moran's I, quantify whether nearby values resemble each other more than a random arrangement would predict. When autocorrelation is present, spatial regression models — implemented in libraries like PySAL — estimate relationships while controlling for location structure. Interpolation (kriging, inverse distance weighting) estimates values at unmeasured points from nearby samples, common in environmental and geologic work.
The table below maps methods to typical questions. Use it before reaching for a tool.
| Method | Question it answers | Typical input | Common tool |
|---|---|---|---|
| Choropleth mapping | How does a metric vary across regions? | Polygon + attribute | QGIS, GeoPandas |
| Hot-spot analysis (Gi*) | Where do clusters of high/low values occur? | Point or polygon counts | ArcGIS, PySAL |
| Moran's I | Is there significant spatial autocorrelation? | Point/polygon values | PySAL, R spdep |
| Spatial regression | What predicts an outcome after accounting for location? | Points + covariates | PySAL, GeoDa |
| Kernel density | Where is event density highest? | Point events | QGIS, scipy KDE |
| Buffer + overlay | What features fall within distance X? | Points/lines/polygons | PostGIS, GeoPandas |
Choosing the wrong method — running ordinary least squares on spatially correlated residuals, for example — is one of the most common failures in spatial data analysis. Match the method to the question first; select software second.
Tools Compared
The spatial data analysis toolchain spans desktop GIS, spatial databases, and Python libraries. No single product covers every workflow; teams often combine a visual GIS for exploration with scripted pipelines for production.
| Tool | Type | Strengths | Best for |
|---|---|---|---|
| QGIS | Open-source GIS | Full mapping, processing toolbox, plugin ecosystem | Exploratory mapping, one-off spatial joins |
| ArcGIS Pro | Commercial GIS | Enterprise support, spatial statistics extensions | Regulated industries, large org standards |
| GeoPandas | Python library | Pandas-like API for geometries, integrates with matplotlib | Reproducible Python pipelines |
| PostGIS | Spatial SQL extension | Scalable joins, buffers, overlays in PostgreSQL | Warehouse-scale location queries |
| PySAL | Python spatial stats | Autocorrelation, spatial regression, esda module | Inferential spatial statistics |
| R sf + spdep | R ecosystem | Mature spatial stats, academic workflows | Research, survey-weighted geography |
Scripted spatial data analysis should follow Python documentation conventions for reproducibility: version-controlled notebooks or modules, explicit coordinate reference system (CRS) handling, and tests on known geometries. Desktop GIS excels at visual QA; code excels at repeatability. Most production teams use both.
Common Applications
Spatial data analysis appears wherever place shapes the question. Retail and logistics teams use it for site selection, catchment mapping, and route optimization — combining customer addresses with demographic layers to estimate demand. Public health departments map disease incidence, test for clusters, and target interventions. Urban planners overlay zoning, transit, and population change to guide infrastructure investment.
Environmental science relies heavily on geographic methods: the EPA GIS resources support air-quality modeling, watershed analysis, and facility compliance mapping. Insurance and real estate analysts model hazard exposure — flood zones, wildfire risk — at the parcel level. Marketing teams geocode campaign responses to understand regional performance.
These applications share a thread: the decision depends on where, not just what. Spatial data analysis converts coordinates and boundaries into actionable insight — provided analysts respect spatial dependence, choose honest map design, and validate assumptions about stationarity across the study area.
A Practical Site-Selection Example
Consider a regional retailer evaluating three candidate store locations. The analyst geocodes two years of transaction records, aggregates revenue by census tract, and joins tract-level population and median income from public boundary files. Before modeling, she tests Moran's I on tract revenue and finds significant positive autocorrelation — confirming that spatial data analysis methods, not ordinary regression alone, are appropriate.
She builds kernel density surfaces of existing customer points to visualize demand concentration, then buffers each candidate site by five and ten miles and overlays competitor locations from a commercial POI dataset. A spatial regression in PySAL models expected revenue as a function of income, population, and distance to nearest competitor while including a spatial lag term for neighboring tract performance. The model ranks candidates and produces prediction intervals, not single-point forecasts.
Practical example: the deliverable is a map layer stakeholders can inspect plus a reproducible script that reruns when demographics update. Documenting CRS choices, join keys, and why spatial regression beat OLS on residual diagnostics makes the spatial data analysis defensible in executive review — the demonstrated-outcome standard that Harvard Business Review's skills-based hiring research and IBM's augmented analytics guidance both emphasize for governed analytics.
Pitfalls That Invalidate Results
Several errors recur in spatial data analysis and are avoidable with discipline. Ignoring spatial dependence — applying standard t-tests or OLS to geographically correlated data — inflates significance and produces overconfident maps. The modifiable areal unit problem (MAUP) means aggregating points into different polygon boundaries changes apparent patterns; document your zoning choice and test sensitivity where stakes are high.
Misleading maps distort decisions: plotting raw case counts instead of rates makes dense urban areas look like hot spots regardless of risk; poor color breaks create false boundaries. Confusing spatial correlation with causation remains as dangerous here as in any analysis — proximity does not prove mechanism. Finally, mixing coordinate reference systems without reprojection produces silent errors; always declare and verify CRS in spatial data analysis pipelines.
Privacy adds another layer. Precise geolocation of individuals is sensitive; aggregate or perturb when publishing. Responsible spatial data analysis balances insight with data minimization, especially for mobile and IoT location feeds.
AI and Spatial Work in 2026
AI-native platforms compress routine geographic tasks — geocoding cleanup, SQL over spatial warehouses, first-pass map generation — while specialists retain judgment over method choice and map honesty. Agents can draft PostGIS queries or GeoPandas joins from natural language, but they cannot replace understanding of spatial dependence or MAUP.
For multi-source warehouse work, supplement hand-written code with governed AI-assisted analysis. We explain the paradigm in what AI-native data analysis means. The Stanford HAI AI Index documents how quickly these tools expanded access to query-first analytics; spatial data analysis expertise still determines whether the map and model are valid. Dedicated GIS remains essential for deep cartography and regulated workflows; AI broadens who can start a location analysis and how fast it reaches a first draft.
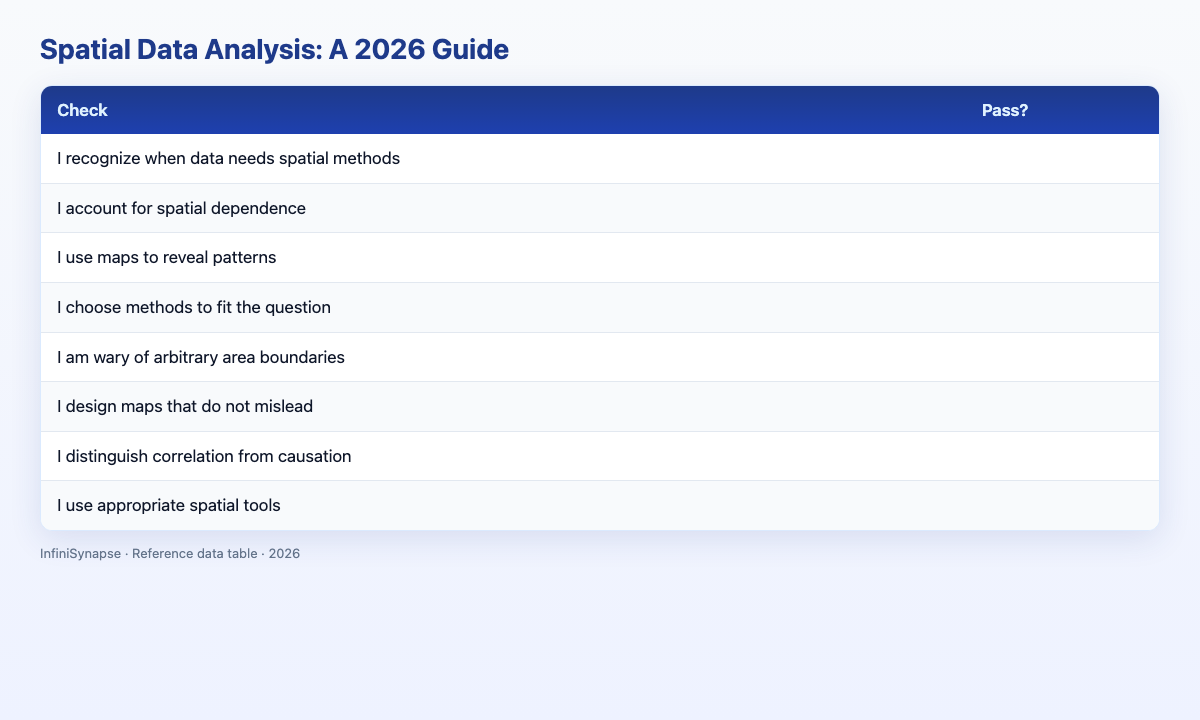
Spatial Analysis Scorecard
Evaluate your spatial data analysis before publishing results (1 point each):
| Check | Pass? |
|---|---|
| I confirmed spatial dependence affects my data | |
| I chose methods suited to points, lines, or polygons | |
| I use rates or normalized values on choropleth maps | |
| CRS is documented and consistent across layers | |
| I tested sensitivity to aggregation boundaries where relevant | |
| Maps avoid misleading color or classification choices | |
| I distinguish spatial correlation from causation | |
| The workflow is reproducible or audit-ready |
6–8: sound spatial data analysis ready for stakeholders. 3–5: strengthen one method or design choice. Below 3: revisit spatial dependence and CRS basics.
Practical Next Steps
Verify against real job postings
Before committing time or budget, pull five recent job postings in your target market and list the SQL, visualization, and communication skills each repeats. Align your learning plan to those patterns rather than a generic syllabus.
Frequently Asked Questions
What is spatial analysis?
Spatial data analysis examines data with a geographic or location component — coordinates, addresses, census tracts — to find patterns tied to place. It accounts for spatial dependence (nearby locations tending to resemble each other) using methods like mapping, spatial clustering, autocorrelation tests, and spatial regression, through tools such as GeoPandas, QGIS, and PostGIS.
Why does location require special analysis methods?
Location violates the independence assumption of standard statistics: neighboring observations often correlate. Spatial data analysis uses specialized methods to measure and model that dependence, distinguishing real geographic patterns from artifacts of proximity. Applying ordinary methods to spatially correlated data can overstate confidence and produce invalid conclusions.
What GIS tools work best?
Common tools include QGIS and ArcGIS Pro for desktop GIS, GeoPandas and PySAL for Python workflows, and PostGIS for spatial SQL at scale. Teams often combine a GIS for exploration with scripted pipelines for reproducible spatial data analysis.
What are common use cases?
Applications include retail site selection and territory planning, disease cluster detection in public health, land-use and transportation planning, environmental exposure mapping supported by agencies like the EPA GIS program, logistics route optimization, and insurance hazard modeling — anywhere the question depends on where.
How does AI assist location work?
AI-native tools accelerate geocoding cleanup, spatial SQL generation, and first-pass mapping, lowering the barrier to entry. They do not replace expertise in spatial dependence, CRS handling, or honest map design. Human judgment remains essential for valid spatial data analysis, especially when decisions carry regulatory or safety consequences.
Conclusion
Spatial data analysis adds the geographic dimension analysis needs when place shapes the question — through mapping, spatial statistics, and reproducible tools like GeoPandas, QGIS, and PostGIS. Evaluate methods against spatial dependence, document your CRS and aggregation choices, and communicate findings on maps designed to inform rather than mislead.
To practice location-aware analysis with governed AI assistance, read what AI-native data analysis means and try the InfiniSynapse web app free on registration, no credit card required.