Tools for Data Analysis: Picks by Use Case in 2026
By the InfiniSynapse Data Team · Last updated: 2026-07-09 · We build an AI-native data analysis platform and evaluate competing products on real customer workloads; these use-case picks come from hands-on testing, not affiliate placement.
Table of Contents
- TL;DR
- How We Evaluated These Picks
- Match the Tool to the Use Case
- Ad-Hoc Questions
- Shared Dashboards
- Statistics and Modeling
- Recurring, Multi-Source Reports
- Use-Case Picker
- What Data Analysts Actually Use in a Week
- Combining Tools Without Creating Chaos
- Scorecard
- Trying Tools Before You Commit
- Failure Modes
- Frequently Asked Questions
- Conclusion
TL;DR
Direct answer: the best tools for data analysis are the ones that match your use case—spreadsheets for ad-hoc math, BI platforms for shared dashboards, notebooks for statistics, and AI-native agents for recurring, multi-source reports. There is no single winner; there is a right tool per job.
Who this is for: anyone comparing tools for data analysis and wanting a use-case answer rather than a generic ranking.
What you'll learn: the four dominant use cases, which tools win each, a picker that maps your situation to a recommendation, a scorecard, and the failure modes that trip up buyers.
This is the use-case companion to our data analysis tools hub; for a business-buyer roundup by budget, see best data analysis software. For a selection framework, see how to choose a data analysis tool.
For related depth in this pillar, see Software for Data Analysis: Free vs Paid in 2026.
How We Evaluated These Picks
We evaluated tools for data analysis by running each against four dominant use cases—ad-hoc questions, shared dashboards, statistics and modeling, and recurring multi-source reports—not a generic feature leaderboard. Each product was tested on source connectivity, performance at production scale, traceability, and whether finished work survives for reuse. We aligned stage definitions with the Wikipedia overview of data analysis, which describes inspecting, cleaning, transforming, modeling, and communicating data.
We cross-referenced autonomy trends with IBM's augmented analytics overview and adoption velocity with the Stanford HAI AI Index. For spreadsheet, BI, and code baselines we referenced Microsoft Learn's Excel documentation, Tableau's getting-started guide, and the Python documentation for reproducible notebook workflows.
The table below summarizes the evaluation dimensions we applied when matching tools for data analysis to use cases.
| Evaluation dimension | Why it matters in 2026 | What we tested |
|---|---|---|
| Use-case fit | Wrong tool for the job wastes budget | Ad-hoc, dashboards, stats, recurring reports |
| Source connectivity | Migration projects kill ROI | Connect Snowflake, Postgres, Excel in place |
| Data scale | Spreadsheets choke; warehouses do not | Same task at 100K vs 10M+ rows |
| Traceability | Wrong numbers destroy trust | Every metric links to an inspectable query |
| Reuse | Recurring work dominates analyst time | Repeat the same report a month later |
| Accessibility | Specialist-only tools bottleneck teams | Non-experts can operate after minimal training |
| Trial on real data | Demos hide real failures | Messy production export, not vendor CSV |
| Total cost | License is only part of the bill | License plus analyst hours saved or consumed |
Match the Tool to the Use Case
Most disappointing purchases happen because a buyer asked "what are the best tools for data analysis?" instead of "what am I actually trying to do?" The generic question has no useful answer; the specific one almost answers itself.
Key Definition: tools for data analysis are software applications that acquire, clean, analyze, and visualize data. The right choice is defined by the use case—ad-hoc, dashboards, statistics, or recurring reports—not by a universal leaderboard.
The underlying activity is the same across use cases, as the Wikipedia data analysis overview describes: inspect, clean, transform, model, communicate. What differs is which stage dominates your work, and that determines which of the tools for data analysis earns its place in your stack.
Ad-Hoc Questions
When you need a quick answer to a one-off question, the winning tools for data analysis are the ones with the least setup. Spreadsheets lead here: Microsoft Excel and Google Sheets open instantly and handle pivots, filters, and charts for small tables. Our guide to using Excel for data analysis covers where the spreadsheet ceiling sits.
The rising alternative for ad-hoc work is an AI-native agent you can simply ask in plain language. Instead of building a pivot table, you type the question and receive the answer plus the query that produced it. For anything past a few hundred thousand rows, the agent scales where the spreadsheet stalls.
Shared Dashboards
When many people need to view the same metrics on a schedule, the right tools for data analysis are BI platforms. Tableau, Power BI, and Looker turn a governed dataset into interactive dashboards that non-analysts can explore. Their strength is distribution: build once, share widely. See Tableau as a data analysis tool and top data analysis platforms compared for how the major options differ.
The catch is that dashboards assume clean, modeled data upstream. A BI platform is a presentation layer, not a data-preparation engine, so pairing it with a preparation tool is common. IBM's augmented analytics overview tracks how BI vendors are adding AI features to close that preparation gap.
Statistics and Modeling
When the work is genuine statistics or machine learning, the strongest tools for data analysis are notebooks and statistical packages. Python (with pandas, scikit-learn, and statsmodels) and R give you unlimited method coverage, and the Python documentation is the reference for reproducible scripted work. SPSS, SAS, and Stata remain standards where documented, defensible procedures matter more than flexibility.
The cost is skill: someone must write and maintain the code or know the statistical package. For teams without that capacity, an AI-native agent can now run many standard analyses—regressions, cohort comparisons, forecasts—from a plain-language goal, though bespoke research modeling still belongs in a notebook.
Recurring, Multi-Source Reports
This is the use case where 2026's tools for data analysis diverge most sharply from earlier generations. When the same report must run every week, pulling from several sources, the winning tool is an AI-native agent that remembers prior work.
For warehouse-scale or multi-source work, supplement spreadsheets or BI tools with hands-on AI practice. We explain the paradigm in what AI-native data analysis means, and the Stanford HAI AI Index tracks how quickly agent-assisted analysis matured. Warehouse-governed teams should validate lineage the way Databricks documentation recommends. For the query-generation angle see natural language to SQL.
Use-Case Picker
Use this to jump from situation to recommendation.
| Your situation | Recommended tools for data analysis | Official link |
|---|---|---|
| Quick one-off question, small data | Excel or Google Sheets | microsoft.com |
| Many viewers, scheduled dashboards | Tableau or Power BI | tableau.com |
| Custom statistics or ML | Python / R notebook, or SPSS | python.org |
| Weekly report across many sources | AI-native agent + Snowflake | snowflake.com |
| Non-technical user, real analysis | AI-native agent + spreadsheet | See AI-native guide |
| Regulated, documented procedures | Statistical package + audit trail | ibm.com/products/spss-statistics |
Most teams land on two rows, not one. A common healthy stack is a spreadsheet for quick math, a BI layer for sharing, and an AI-native agent for the recurring, multi-source work that used to consume analyst afternoons.
Practical example: a healthcare operations team needs weekly patient-throughput reports from Snowflake, a manual Excel adjustment file, and a Power BI dashboard for leadership. They match each use case to the right row in the picker above, then present IT with a stack diagram showing 55% less weekly prep time after adding an AI-native agent for the multi-source pull. The CIO approves because the evidence aligns with what Harvard Business Review's skills-based hiring research describes as increasingly decisive: demonstrated outcomes over generic rankings.
What Data Analysts Actually Use in a Week
It helps to see how the categories combine in practice rather than in theory. A typical analyst week touches three or four tools for data analysis, each for the stage it handles best, and the handoffs between them are where time quietly leaks.
Monday often starts with a spreadsheet: a stakeholder wants a quick number, and opening a sheet is faster than spinning up anything heavier. By midweek the questions get deeper, so the analyst writes SQL against a warehouse or asks an agent to run a multi-step pull across sources. Thursday tends to be dashboard day, refreshing the BI views that leadership reviews. Friday is documentation and cleanup. Across that week, the best tools for data analysis are the ones that reduce the friction of moving work from one stage to the next, not the ones with the longest feature list.
The pattern reveals a truth that generic rankings miss: the tool that saves the most time is usually the one that eliminates a handoff. When an agent can pull, clean, and chart in one step, the Tuesday-to-Thursday sequence collapses into a single request, and the analyst spends the reclaimed hours on interpretation instead of plumbing.
Combining Tools Without Creating Chaos
Because no single product wins every stage, most teams run a small stack. The risk is that a stack becomes a maze of exports, copies, and conflicting numbers. Three principles keep a combination of tools for data analysis healthy.
First, designate one source of truth for each metric so two tools never disagree about what "active user" means. Second, minimize manual exports; every hand-copied file is a future inconsistency. Third, prefer tools that connect directly to your sources rather than to each other's outputs, because chains of exports break silently. A stack built on these principles stays trustworthy as it grows.
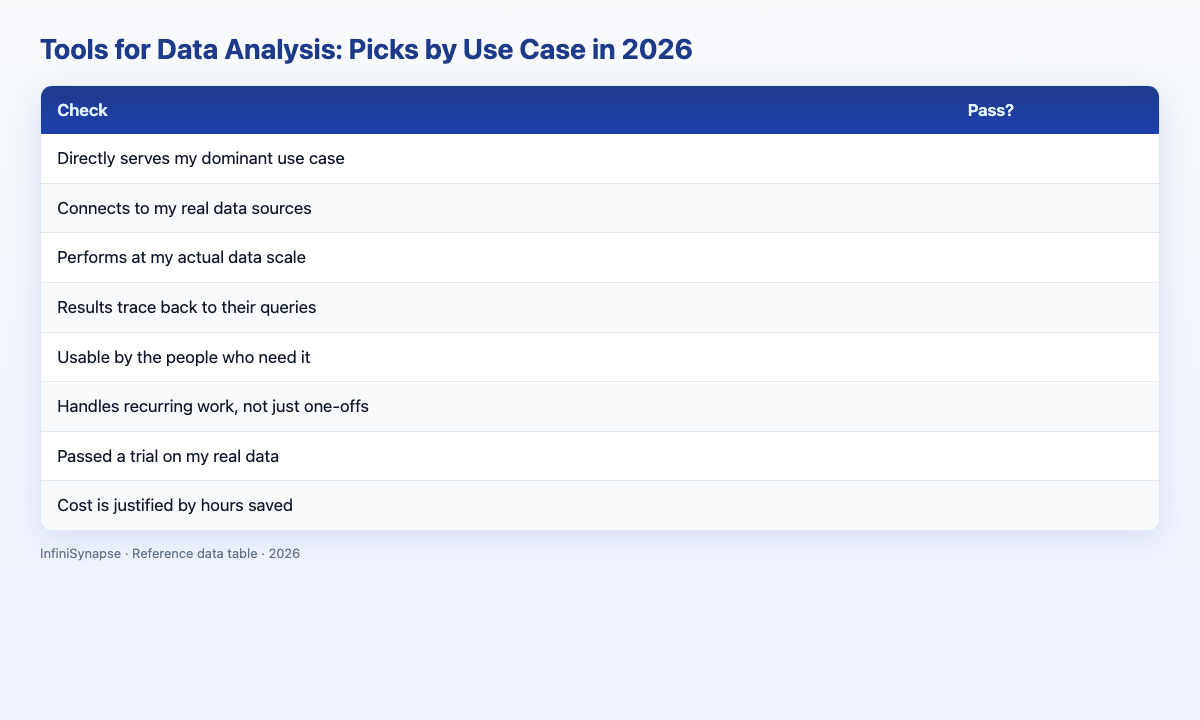
Scorecard
Rate any candidate among your tools for data analysis (1 point each):
| Check | Pass? |
|---|---|
| Directly serves my dominant use case | |
| Connects to my real data sources | |
| Performs at my actual data scale | |
| Results trace back to their queries | |
| Usable by the people who need it | |
| Handles recurring work, not just one-offs | |
| Passed a trial on my real data | |
| Cost is justified by hours saved |
6–8: strong fit (~30% of candidates we test). 3–5: scope to one use case (~45%). Below 3: keep looking.
Trying Tools Before You Commit
The single best predictor of a good outcome is a real trial. Before committing to any of the tools for data analysis on your shortlist, run a two-part test on your own data. First, load a genuinely messy source—your real export or a live database connection—and ask the tool to answer a question you already know the answer to. This checks correctness, not presentation, and it exposes tools that quietly make wrong assumptions about types, nulls, or duplicate keys.
Second, repeat that same task a week later and count how much setup you had to redo. The gap between the first run and the second is the truest measure of long-term cost, and it is invisible in a polished demo. Involve the people who will actually use the tool, not only the person evaluating it. Many tools for data analysis look excellent in expert hands and collapse when a non-specialist tries the same task.
Failure Modes
Failure 1: Universal-ranking thinking. Chasing the "best" tool ignores that the best tools for data analysis are use-case specific.
Failure 2: Dashboards on dirty data. A BI platform presents; it does not clean. Fix preparation upstream.
Failure 3: Over-buying for statistics. Not every team needs SAS; many "statistics" needs are cohort cuts an agent can run.
Failure 4: Ignoring the recurring case. A tool that forgets every session is costly across a year of weekly reports.
Frequently Asked Questions
What are the best picks by use case?
The best tools for data analysis depend on your use case: spreadsheets (Excel, Google Sheets) for ad-hoc math, BI platforms like Tableau or Power BI for shared dashboards, Python or R notebooks for statistics and machine learning, and AI-native agents for recurring, multi-source reports. Most teams combine two of these.
What tools do data analysts use day to day?
Day to day, data analysts use a mix: a spreadsheet for quick checks, SQL against a warehouse for pulls, a BI platform for dashboards, and increasingly an AI-native agent that plans and runs multi-step analysis from a plain-language goal. The exact mix depends on the industry and data scale.
What are good free options?
Good free tools for data analysis include Google Sheets and LibreOffice Calc for spreadsheets, Python and R for code-based work, Tableau Public for visualization, and the free tiers of AI-native platforms. A spreadsheet plus a free AI-native tier covers most beginner needs.
Do I need to code to use these tools?
No. Spreadsheets, BI platforms, and AI-native tools for data analysis all work without code. Coding unlocks custom statistics and machine learning, but everyday cleaning, joining, metrics, and charts can be produced by describing the goal to an AI-native agent.
Which picks fit recurring reports?
For recurring reports across multiple sources, AI-native agents are the strongest fit because they remember schema and metric definitions between runs, so a weekly report becomes a single sentence rather than a fresh setup each time. BI platforms handle recurring viewing; agents handle recurring preparation.
Conclusion
The best tools for data analysis in 2026 are chosen by use case, not by leaderboard. Name what you are actually doing—ad-hoc questions, dashboards, statistics, or recurring reports—and the right tool, or pair of tools, becomes obvious.
To practice AI-native workflows on your own data, try the InfiniSynapse web app free on registration, no credit card required.