Topological Data Analysis, Made Practical (2026)
By the InfiniSynapse Data Team · Last updated: 2026-07-09 · We build an AI-native data analysis platform and evaluate advanced methods against when shape-based structure actually changes decisions.
Table of Contents
- TL;DR
- How We Evaluated TDA Methods
- The Shape-of-Data Intuition
- Persistent Homology Explained
- Tools and Libraries Compared
- Where TDA Applies
- A Practical Workflow Example
- When Simpler Methods Suffice
- AI and Advanced Methods in 2026
- TDA Readiness Scorecard
- Practical Next Steps
- Frequently Asked Questions
- Conclusion
TL;DR
Direct answer: topological data analysis (TDA) studies the shape of data — connected components, loops, voids — to reveal structure that correlation and clustering miss. It is most valuable for complex, high-dimensional datasets where global geometry matters, implemented through libraries like GUDHI and Ripser.py after you have exhausted simpler exploratory methods.
Who this is for: analysts and researchers evaluating whether topological data analysis is worth the learning investment for a specific problem.
What you'll learn: how we evaluated TDA, the shape intuition, persistence, tool comparisons, a practical workflow, when to skip TDA, and how AI-native workflows relate.
This guide sits within the advanced methods hub. For related depth in this pillar, see Spatial Data Analysis and Bayesian Data Analysis: Intuition First. For the broader method landscape, see data analysis methods.
How We Evaluated TDA Methods
We selected topological data analysis approaches for this guide using criteria that reflect when TDA actually changes outcomes in 2026, not mathematical novelty alone. Each method was checked against four dimensions: whether the data is high-dimensional enough that local summaries hide global structure, whether persistent features survive reasonable noise levels, whether results are interpretable to domain stakeholders, and whether simpler baselines (PCA, clustering, UMAP) were attempted first.
How We Evaluated Tda: What To Verify
We cross-referenced these criteria with the general analytical framework in the Wikipedia data analysis overview and with topology foundations in the Wikipedia topology overview. TDA sits at the advanced end of that spectrum; its value proposition is detecting cyclic or branching structure — rings, tunnels, separate components — that pointwise statistics overlook. The scikit-learn user guide reinforces a baseline discipline we apply here too: start with interpretable, well-validated methods before escalating complexity.
How We Evaluated Tda: In Practice
Computational reproducibility and library maturity matter. A topological data analysis pipeline locked in a one-off script without versioned dependencies fails the same audit tests as any opaque model. We favor open implementations with active maintenance — GUDHI, Ripser.py — and workflows that document filtration parameters and distance metrics. Enterprise teams increasingly pair exploratory TDA with governed analytics described in IBM's augmented analytics overview, while the Stanford HAI AI Index tracks how AI assistants accelerated routine EDA, freeing specialists to apply methods like TDA where structure genuinely matters.## The Shape-of-Data Intuition
The core intuition behind topological data analysis is that data has shape, and shape carries meaning. Plot points in two or three dimensions and you may see a single blob, several clusters, a ring, or branching arms. TDA formalizes those observations: connected components count separate groups; one-dimensional holes (loops) suggest cyclic dynamics; higher-dimensional voids appear in richer embeddings.
This global view distinguishes TDA from correlation matrices, which capture pairwise relationships but not overall connectivity. A dataset can show weak pairwise correlations yet form a clear ring — a pattern topological data analysis detects through persistent homology but ordinary linear methods miss. Grasping that distinction is the key to knowing when TDA earns its complexity.
Hold a simple mental model: imagine connecting points that fall within distance ε of each other, then slowly increasing ε. Early on, many isolated points exist; as ε grows, clusters merge, loops close, and eventually everything connects. TDA tracks which features appear and how long they persist across ε. Long-lived features are signal; short-lived ones are often noise.
Persistent Homology Explained
Persistent homology is the workhorse of topological data analysis. Given a point cloud and a distance metric, it builds a sequence of simplicial complexes ( Vietoris–Rips or Alpha filtrations are common ) and records when topological features — components, loops, voids — appear and disappear as the scale parameter changes.
The output is often a persistence diagram or barcode: each feature is a point (birth, death) in scale space. Features far from the diagonal persisted across many scales and are treated as meaningful; near-diagonal features died quickly and are treated as noise. This multiscale robustness is why topological data analysis handles noisy biological and sensor data better than single-threshold clustering.
The Mapper algorithm offers a complementary, visualization-friendly path: filter data through a lens function ( PCA coordinate, density ), cover the range, cluster within slices, and connect clusters that overlap. KeplerMapper implements this pipeline for exploratory TDA. Mapper does not replace persistence but helps analysts and domain experts see shape interactively.
Parameter choices — distance metric, filtration type, maximum dimension — affect results. Document them as carefully as you would hyperparameters in scikit-learn models. Topological data analysis is not parameter-free; it is parameter-explicit.
Tools and Libraries Compared
Topological data analysis implementations span C++ libraries with Python bindings and pure Python packages. The table below compares options we see most often in production-adjacent research and advanced analytics teams.
| Tool | Language | Strengths | Best for |
|---|---|---|---|
| GUDHI | C++/Python | Full TDA stack, Rips/Alpha complexes, persistence | Research-grade persistent homology |
| Ripser.py | Python | Fast Vietoris–Rips persistence | Large point clouds, quick diagrams |
| KeplerMapper | Python | Mapper graphs, sklearn integration | Exploratory visualization with stakeholders |
| scikit-tda | Python | Ecosystem hub, tutorials | Learning TDA in Python |
| R TDA package | R | Academic workflows | Statistics-heavy research teams |
Scripted topological data analysis should follow Python documentation conventions: pinned dependencies, saved diagrams, and notebooks that record random seeds and preprocessing ( scaling, outliers ). TDA is sensitive to preprocessing; z-scoring and duplicate removal should be logged.
Where TDA Applies
Topological data analysis has found traction where data are complex and structure is hypothesized but not obvious. In biology, persistence has highlighted shape in gene expression and protein interaction networks. Neuroscience applies TDA to high-dimensional brain-activity recordings. Materials science uses topological summaries to characterize porous or networked structures. In machine learning, TDA helps probe loss landscapes and latent embeddings when debugging models.
The common thread is high dimensionality plus structural hypotheses — cycles, branching, multiple regimes — that local methods blur. Topological data analysis is not a default step in every pipeline; it is a specialist lens for problems where the shape of the point cloud is itself the object of inference.
Teams in finance or operations occasionally use Mapper on customer-behavior embeddings to reveal segments that k-means collapsed together. Public health researchers have applied persistence to sensor time-delay embeddings. Each case succeeded because analysts stated a shape question first, then chose TDA — not the reverse.
A Practical Workflow Example
Suppose a manufacturing team monitors hundreds of sensor channels on a production line and suspects periodic fault modes that standard alarms miss. The analyst exports normalized windows labeled normal versus pre-failure, embeds them with PCA to twenty dimensions for computational tractability, and runs Ripser persistence on each class.
Persistence diagrams show a prominent one-dimensional loop feature persisting across scales in pre-failure windows but not in normal windows — evidence of cyclic dynamics consistent with a bearing defect hypothesis. She validates with KeplerMapper using PCA-1 as a lens, producing a graph stakeholders can navigate: normal operations form a simply connected blob; pre-failure windows branch toward a loop-shaped region.
Practical example: TDA here did not replace domain experts or spectral diagnostics; it surfaced a structural hypothesis for targeted inspection. The deliverable pairs diagrams with preprocessing code, filtration settings, and a plain-language note that topological data analysis suggests cyclic structure — not root-cause proof. That documented reasoning mirrors what Harvard Business Review's skills-based hiring research and IBM's augmented analytics overview describe as decisive in governed decision workflows.
When Simpler Methods Suffice
Topological data analysis is overkill when data is low-dimensional, questions are answered by regression or clustering, or stakeholders need coefficients they can act on directly. If PCA plus k-means separates classes cleanly and persistence adds no new actionable feature, stop.
The learning cost is real: filtrations, homology groups, and diagram interpretation require study. Reserve topological data analysis for cases where conventional EDA failed and shape is central to the scientific or operational question. The scikit-learn documentation covers baselines — decomposition, manifold learning, clustering — that should precede TDA in most workflows.
Judgment matters as much as software. Escalate to topological data analysis when you can articulate what shape would mean for the domain — a cycle implicating periodic failure, disconnected components implicating distinct regimes — and when simpler plots did not reveal it.
AI and Advanced Methods in 2026
AI-native platforms handle routine exploration — distributions, correlations, standard clustering — freeing specialists to apply topological data analysis only where warranted. Agents can suggest Ripser or Mapper code snippets, but interpreting persistence diagrams still requires human statistical and domain judgment.
For warehouse-scale work, supplement hand-written code with governed AI-assisted analysis. We explain the paradigm in what AI-native data analysis means. The Stanford HAI AI Index documents rapid adoption of agent-assisted EDA; topological data analysis remains a deliberate escalation for structure-rich problems, not a default click. Predictive workflows built on TDA features should still be validated against held-out data using standard ML practice in scikit-learn.
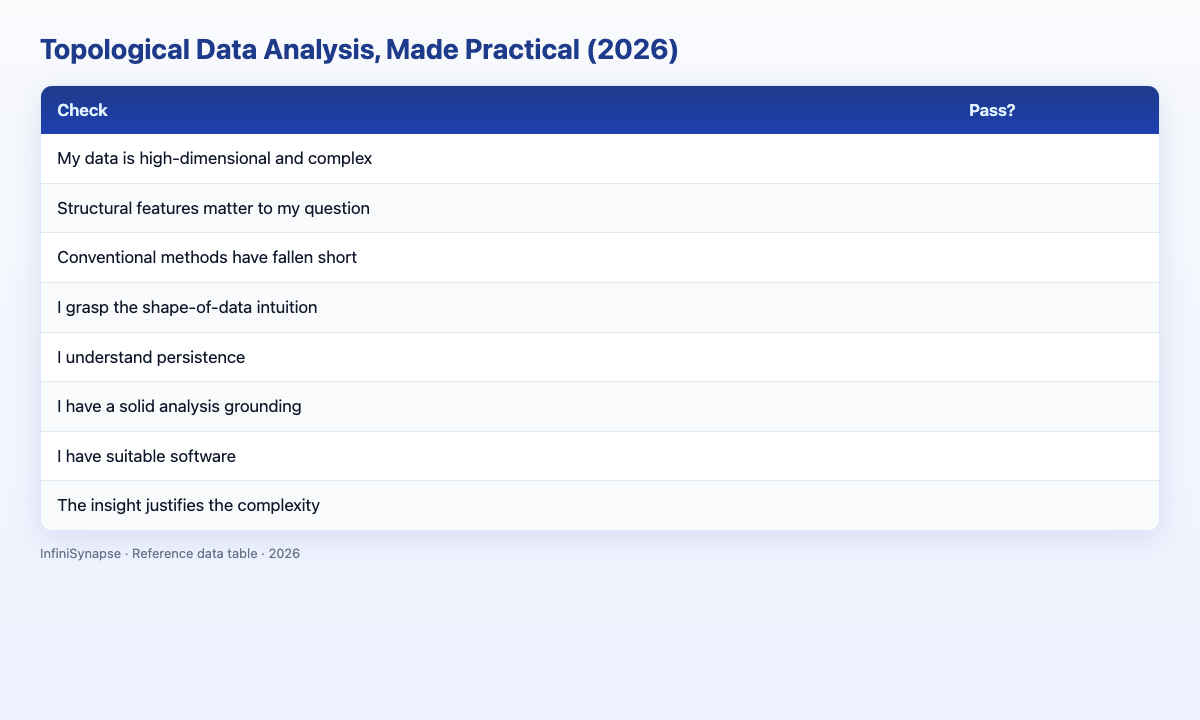
TDA Readiness Scorecard
Assess whether topological data analysis fits your problem (1 point each):
| Check | Pass? |
|---|---|
| My data is high-dimensional or structurally complex | |
| I have a shape-based hypothesis (loops, components, branches) | |
| Simpler methods (PCA, clustering) did not answer the question | |
| I understand persistence and filtration at a conceptual level | |
| I can document preprocessing and distance metrics | |
| I have suitable software (GUDHI, Ripser, KeplerMapper) | |
| Stakeholders can interpret Mapper or diagram outputs | |
| The insight justifies TDA's learning and compute cost |
6–8: topological data analysis may be worth pursuing. 3–5: strengthen baselines first. Below 3: standard methods likely suffice.
Practical Next Steps
Verify against real job postings
Before committing time or budget, pull five recent job postings in your target market and list the SQL, visualization, and communication skills each repeats. Align your learning plan to those patterns rather than a generic syllabus.
Frequently Asked Questions
What is TDA?
Topological data analysis (TDA) applies ideas from topology to study the shape of data — how points connect, form loops, or separate into components — using tools like persistent homology and the Mapper algorithm. It reveals global structure that local statistics miss and is most useful for complex, high-dimensional datasets.
What is persistence in TDA?
Persistence tracks topological features across scales: features that appear and persist over many distance thresholds are treated as meaningful signal in topological data analysis, while short-lived features are treated as noise. Persistence diagrams and barcodes visualize this multiscale behavior.
What software implements TDA?
Common libraries include GUDHI and Ripser.py for persistent homology, KeplerMapper for Mapper graphs, and the broader scikit-tda ecosystem. R users may use the CRAN TDA package.
When should you use TDA?
Use topological data analysis when data is high-dimensional, structural features (cycles, branching, multiple regimes) matter to the question, and simpler exploratory methods have not revealed the pattern. For low-dimensional or coefficient-driven questions, standard methods in scikit-learn are usually sufficient.
How does AI relate to TDA?
AI-native tools accelerate routine EDA and code scaffolding for TDA libraries, but interpreting persistence diagrams and choosing filtrations still requires human expertise. Topological data analysis remains a specialist method applied deliberately while AI handles everyday analytics at scale.
Conclusion
Topological data analysis reveals the shape of complex data — loops, components, persistent features — through tools like GUDHI, Ripser, and KeplerMapper when simpler methods fall short. Start with clear shape hypotheses, document preprocessing and parameters, and treat TDA as hypothesis generation inside governed workflows. Teams that pair persistence diagrams with domain review and reproducible scripts avoid treating shape summaries as proof — the discipline that keeps topological data analysis credible when executives ask hard questions about causation. Save filtration parameters and random seeds so a colleague can reproduce the same diagram on the same export.
For everyday analysis that standard methods handle well, read what AI-native data analysis means and try the InfiniSynapse web app free on registration, no credit card required.