What Is Data Analysis? A 2026 Beginner's Guide
By the InfiniSynapse Data Team · Last updated: 2026-07-09 · We build an AI-native data analysis platform and teach newcomers constantly; this beginner's guide reflects how the concept is best learned in 2026.
Table of Contents
- TL;DR
- How We Evaluated This Beginner Guide
- The Simple Answer
- Breaking Down the Concept
- A Simple Worked Example
- Why It Matters
- Who Does It
- How to Start Learning It
- Common First Questions to Try
- Tools That Help You Start
- Beginner Scorecard
- Common Misconceptions
- Frequently Asked Questions
- Conclusion
TL;DR
Direct answer: what is data analysis? It is the process of examining data to find useful information that helps make decisions. You gather data, clean it, look for patterns, and explain what those patterns mean. That is the whole idea, and everything else is detail built on this simple foundation.
Who this is for: complete beginners asking what is data analysis for the first time.
What you'll learn: how we evaluated this guide, a simple answer, the concept broken into plain parts, a worked example, why it matters, who does it, and how to start learning.
For the full discipline, see our complete data analysis guide; for a formal definition, see data analysis definition. For plain-English meaning, see data analysis meaning.
How We Evaluated This Beginner Guide
We shaped this answer to what is data analysis using criteria that mirror how educators and hiring managers introduce the concept to newcomers, not how advanced practitioners debate methodology. Each section was checked against four dimensions: plain-language clarity, alignment with authoritative definitions, a workable first project path, and whether the explanation acknowledges how AI-assisted tooling changed learning in 2026.
We cross-referenced the underlying activity with the Wikipedia overview of data analysis, which frames analysis as inspecting, cleaning, transforming, and modeling data to surface useful information. We aligned autonomy expectations with IBM's augmented analytics overview, which tracks how AI-assisted workflows reshape what beginners can accomplish early. The Stanford HAI AI Index documents how quickly agent-assisted analysis moved from research into daily practice. For career context we referenced the Bureau of Labor Statistics occupational profile for data analysts, which lists data inspection and interpretation among core entry-level tasks.
The table below maps the evaluation dimensions we apply when explaining what is data analysis to a first-time learner.
| Evaluation dimension | Why it matters for beginners | Authoritative reference |
|---|---|---|
| Plain-language clarity | Jargon blocks the first step | Wikipedia data analysis |
| Four-part structure | Repeatable mental model | IBM augmented analytics |
| Hands-on first project | Doing beats passive reading | BLS data analysts profile |
| Tool accessibility | Spreadsheets and agents lower barriers | Google Sheets |
| Career relevance | Motivation sustains practice | Harvard Business Review skills-based hiring |
| AI-era expectations | Learners should see modern workflows | Stanford HAI AI Index |
| Communication skill | Insight must be explainable | OECD AI adoption overview |
| Misconception correction | Wrong beliefs waste early effort | Google Cloud AI overview |
The Simple Answer
The simplest way to understand the question what is data analysis is this: it is looking at data carefully to learn something useful. Imagine you have a list of every sale your shop made last month. On its own, that list is just numbers. The work of turning that list into answers — which product sold best, which day was busiest, whether sales are growing — is analysis.
So when someone asks what is data analysis, the honest answer is that it is a form of organized curiosity. You start with a question, you look at the relevant data, and you find an answer you can act on. The concept, described more formally in the Wikipedia overview of data analysis, sounds sophisticated, but at its heart it is something people do intuitively whenever they make sense of information to decide what to do next. Dashboard-centric workflows sit within the broader Wikipedia business intelligence overview.
Breaking Down the Concept
To fully grasp what is data analysis, it helps to break it into four plain parts. First is gathering: collecting the data you need to answer your question. Second is cleaning: fixing errors, removing duplicates, and handling gaps so the data is trustworthy, a step beginners often underestimate but which is essential.
Third in understanding what is data analysis is the analysis itself: looking for patterns, calculating summaries, and comparing groups to find the answer. Fourth is communicating: explaining what you found in a way others can understand and act on. Every instance of what is data analysis in practice, from a simple spreadsheet to a complex study, moves through these same four parts. Learning to see them makes the concept far less intimidating, because it reveals a simple, repeatable structure beneath the technical vocabulary.
A Simple Worked Example
A concrete example makes what is data analysis tangible. Suppose a small café wants to know why some days are busier than others. They have a spreadsheet with each day's date, weather, and number of customers. The question is clear: what makes a day busy?
To answer, they clean the data by fixing a few typos in the weather column, then group days by weather and calculate the average customers for each. They discover sunny days average far more customers than rainy ones. That, in miniature, is analysis: a question, some data, cleaning, a simple calculation, and an actionable finding — that sunny days need more staff. This tiny example contains every essential element of the concept, which is why beginners learn best by working through simple, real questions rather than studying theory in the abstract.
Practical example: a university career-services coordinator helps a student answer what is data analysis by walking through a real internship-application dataset. The student gathers 40 anonymized application records, cleans inconsistent date formats, groups by major and outcome, and finds that applicants with portfolio links received callbacks 2.3× more often. She presents the finding in a one-page summary with a simple bar chart — demonstrated ability that Harvard Business Review's skills-based hiring research describes as increasingly decisive when employers evaluate candidates without traditional credentials.
Why It Matters
Understanding what is data analysis matters because data now informs nearly every decision, from a small business setting prices to a large company planning strategy. The organizations and individuals who can analyze data make better decisions than those who guess, which is why analytical skills are valued across almost every field and industry.
On a personal level, grasping what is data analysis is empowering. It lets you answer your own questions with evidence rather than relying on assumptions or others' opinions. Whether you are tracking a personal budget, evaluating a business idea, or pursuing an analytics career, the ability to turn data into insight is a durable, transferable skill. This broad usefulness is why so many people are learning analysis in 2026, and why it is a worthwhile foundation to build.
Who Does It
Many people ask what is data analysis while wondering who actually does it, and the answer is broader than they expect. Data analysts do it professionally, but so do scientists, marketers, product managers, founders, journalists, and countless others who use data in their work. It is not the exclusive domain of technical specialists.
This breadth is part of what makes learning what is data analysis so worthwhile. Because the skill applies across so many roles, it enhances almost any career rather than confining you to one. A marketer who can analyze campaign data, or a manager who can interpret operational metrics, is more effective than one who cannot. The Stanford HAI AI Index documents how quickly AI capabilities are reshaping analytical work across these roles.
How to Start Learning It
The best way to move beyond asking what is data analysis to actually doing it is to practice on a real question that interests you. Pick some data you care about, whether a personal spreadsheet or public open data, pose one clear question, and work through the four parts: gather, clean, analyze, communicate. Producing one real answer teaches more than hours of passive reading.
As you learn by doing, start with simple tools. A spreadsheet is perfect for beginners, and in 2026 governed AI-assisted agents let you ask questions in plain language and see how the analysis is done, which accelerates learning. Our complete data analysis guide lays out the fuller path, and the data analysis process guide details each step. The key is to begin small, finish real questions, and let curiosity pull you deeper over time.
Common First Questions to Try
The fastest way to move from asking what is data analysis to doing it is to try a first question small enough to finish. Good beginner questions share a shape: they are specific, answerable with data you can actually get, and interesting enough to hold your attention through the tedious cleaning stage. "Which month did I spend the most?" beats "understand my finances," because the former has a clear answer and the latter is a vague aspiration that never quite completes.
A few starter questions work well for almost anyone. From a personal budget, you might ask which category of spending grew most over the year. From a fitness tracker, whether you walk more on weekdays or weekends. From a small business, which product returns the most profit rather than just the most revenue. Each of these gives you a concrete target, forces you through gathering and cleaning, and rewards you with a genuine insight at the end. Finishing one such question teaches more than reading a dozen articles about what is data analysis, because the act of completing the loop, mess and all, is where real understanding forms.
Tools That Help You Start
You do not need expensive or complex software to begin answering what is data analysis for your own questions. A free spreadsheet handles sorting, filtering, simple charts, and basic calculations, which covers a remarkable share of beginner analysis. Its immediacy and transparency — where every number traces to a visible formula — make it an ideal learning environment where nothing hides between you and the data.
In 2026, beginners have a second powerful option: governed AI-assisted agents that let you ask a question in plain language and return both an answer and the steps taken. This is valuable for learning precisely because it shows the reasoning, letting you see how a clean, well-structured analysis is performed rather than only the result. The move toward augmented workflows, outlined in IBM's augmented analytics overview, frames how teams evaluate modern tooling.
| Beginner tool | What it teaches | Best first use | Official link |
|---|---|---|---|
| Google Sheets | Sorting, filtering, basic charts | Personal budget or sales log | workspace.google.com |
| Microsoft Excel | Formulas, pivot tables | Small business tracking | microsoft.com |
| Kaggle Learn | Introductory Python and SQL | Structured self-paced modules | kaggle.com |
| SQLBolt | Querying relational data | First database questions | sqlbolt.com |
| Governed AI agents | Plain-language goals with audit trails | Seeing a full workflow modeled | IBM augmented analytics |
Beginner Scorecard
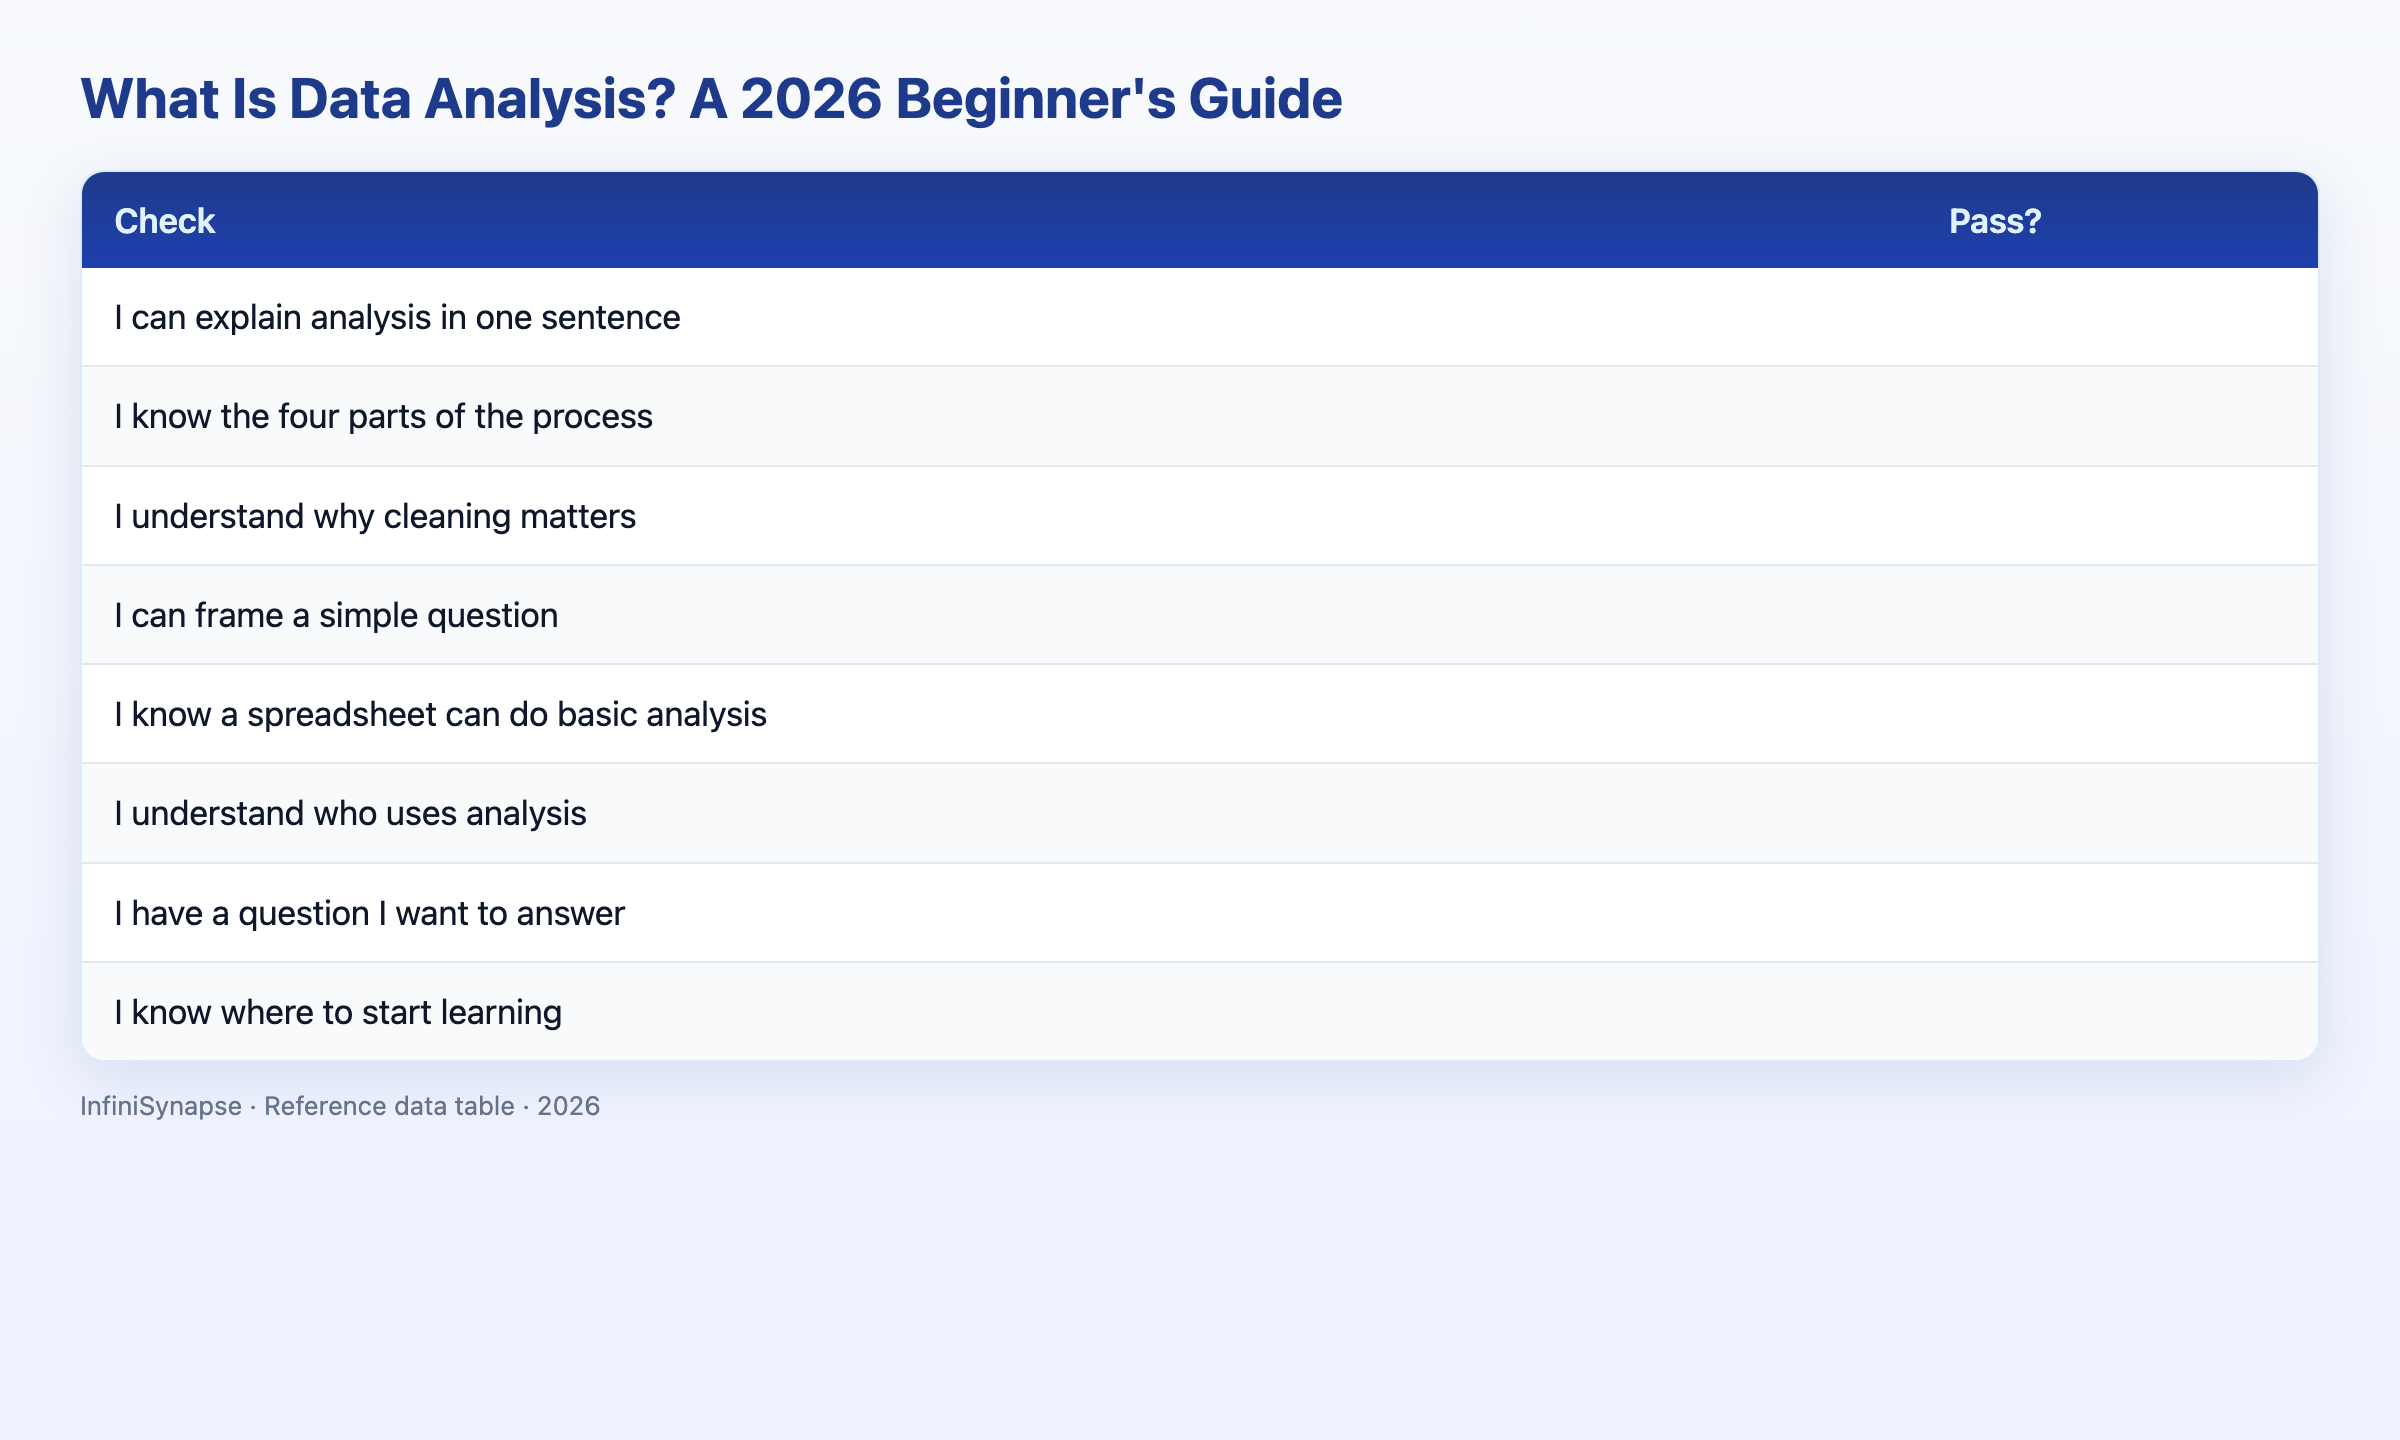
Check your grasp of the concept (1 point each):
| Check | Pass? |
|---|---|
| I can explain analysis in one sentence | |
| I know the four parts of the process | |
| I understand why cleaning matters | |
| I can frame a simple question | |
| I know a spreadsheet can do basic analysis | |
| I understand who uses analysis | |
| I have a question I want to answer | |
| I know where to start learning |
6–8: ready to practice — top ~30% of first-time learners we advise. 3–5: review the simple answer and worked example (~45% of newcomers). Below 3: reread this guide and pick one starter question.
Common Misconceptions
Misconception 1: It requires advanced math. What is data analysis at the basic level? Simple arithmetic and clear thinking — not calculus.
Misconception 2: It is only for experts. People in many roles analyze data; understanding what is data analysis is a broadly useful skill.
Misconception 3: You need to code. Spreadsheets and governed AI-assisted tools let beginners analyze without programming.
Misconception 4: Cleaning is optional. Analyzing dirty data produces wrong answers, so cleaning is essential.
Frequently Asked Questions
What is data analysis in simple terms?
What is data analysis in simple terms? It is examining data carefully to find useful information that helps make decisions. You gather the data, clean it, look for patterns, and explain what they mean. It turns raw numbers into answers you can act on, and it is something people do intuitively whenever they make sense of information.
Is data analysis hard to learn for beginners?
No, the basics behind what is data analysis are quite learnable. At a beginner level it needs only simple arithmetic, clear thinking, and a willingness to practice. Starting with a spreadsheet and a real question you care about, and now with AI-assisted tools that explain their work, makes learning the fundamentals accessible to almost anyone.
Do I need to know math to do data analysis?
For basic analysis, you need only simple arithmetic like averages and percentages, not advanced mathematics. More sophisticated work uses statistics, but a great deal of useful analysis relies on clear questions and simple calculations. Beginners should not be deterred by a fear of math, since the essential skill is organized thinking.
What tools do beginners use for data analysis?
Beginners usually start with a spreadsheet like Excel or Google Sheets, which handles sorting, filtering, and simple calculations without any coding. In 2026, governed AI-assisted agents also let beginners ask questions in plain language and see the analysis performed, which is an excellent way to learn.
Who uses data analysis?
Many people use analysis, not just data analysts. Scientists, marketers, product managers, founders, journalists, and managers all analyze data in their work. Because the skill applies across so many roles, understanding the concept benefits nearly everyone who works with information rather than only technical specialists.
Conclusion
So what is data analysis? It is the process of examining data to find useful information that supports decisions, built from four simple parts: gather, clean, analyze, and communicate. It is more accessible than it sounds, useful across nearly every field, and best learned by practicing on real questions you care about. Start with one small question today, work it through from gathering to conclusion, and you will understand the idea far better than any definition alone could teach you.
To go deeper and see how modern tools make analysis easier, read the complete data analysis guide and what AI-native data analysis means, then try the InfiniSynapse web app free on registration, no credit card required.