Whats a Data Analysis: A Casual Starter Guide for 2026
By the InfiniSynapse Data Team · Last updated: 2026-07-09 · We teach newcomers daily and see the same confusion on day one; this relaxed guide answers whats a data analysis without jargon, grounded in how people actually start.
Table of Contents
- TL;DR
- How We Evaluated the Casual Answer
- The Relaxed Answer in Plain Language
- You Already Do This Every Day
- The Basic Recipe Anyone Can Follow
- Casual Versus Formal Approaches
- What You Do Not Need to Start
- Trying One Yourself This Week
- Growing From Curious to Confident
- Starter Readiness Scorecard
- Practical Next Steps
- Frequently Asked Questions
- Conclusion
TL;DR
Direct answer: whats a data analysis? It is looking at information carefully to answer a question you care about. You pick a question, gather relevant facts, tidy them up, look for patterns, and figure out what they mean. No jargon required—and you probably do a casual version already when you compare options before a purchase or check whether a habit is working.
Who this is for: anyone casually wondering whats a data analysis, with no technical background assumed.
What you'll learn: how we evaluated the casual framing, the relaxed answer, why you already do it, the basic recipe, how casual differs from formal work, and how to try one small question yourself.
For a slightly more structured take, see what is data analysis; for a worked example, see a data analysis example. This guide sits within our data analysis complete guide.
For related depth in this pillar, see Data Analysis Meaning, Explained Simply for 2026.
How We Evaluated the Casual Answer
We framed this guide around criteria that help a complete beginner finish one real question—not criteria that impress specialists. Each explanation was checked against four dimensions: whether the language avoids unnecessary jargon, whether the steps map to something a person can try tonight, whether the example uses data anyone can actually collect, and whether the path to a slightly more rigorous version is visible without overwhelming the reader.
How We Evaluated The: What To Verify
We aligned the underlying activity with the Wikipedia overview of data analysis, which describes inspecting, cleaning, transforming, and modeling data to surface useful information. That formal definition sounds intimidating; our job was to show that the same spine appears in everyday sense-making. IBM's augmented analytics overview informed how we describe modern tools that let beginners ask plain-language questions while still learning the underlying steps. The Stanford HAI AI Index tracks how quickly such assisted workflows moved from research into daily practice—a shift that changes what "getting started" looks like in 2026. For accessible first tools we referenced the Google Sheets function reference and Google Cloud's AI overview, which document how non-specialists increasingly touch analytical workflows.
How We Evaluated The: In Practice
The table below summarizes the evaluation dimensions we apply when explaining whats a data analysis to a first-time learner.
| Evaluation dimension | Why it matters for beginners | What we tested |
|---|---|---|
| Plain language | Jargon scares people off | Can a non-specialist paraphrase each step? |
| Finishability | Learning happens by doing | Can one small question complete in a week? |
| Honest scope | Overclaiming breeds distrust | Are limits stated alongside the answer? |
| Tool accessibility | Cost blocks many starters | Spreadsheet or free tier sufficient? |
| Path to rigor | Curiosity outgrows casual work | Is the bridge to formal methods visible? |
| Pattern recognition | Confidence comes from repetition | Does the recipe repeat across examples? |
| Decision link | Analysis exists to inform action | Does each example end in a choice? |
| Error tolerance | Perfectionism prevents starting | Is "small and imperfect" explicitly OK? |
So whats a data analysis in the most relaxed terms? Looking at information to answer a question you care about. If you have ever checked which streaming subscriptions you actually use before canceling one, you have done a casual version of whats a data analysis without calling it that.
The reason people overthink the whole thing is intimidating vocabulary around a simple idea. You are curious about something, you have information that might answer it, and you look at that information to find out. That is the whole spirit of whats a data analysis. The formal field adds structure and tools, but the casual heart is approachable curiosity applied with a little care.
When someone searches whats a data analysis, they usually want permission to start—not a lecture on statistics. The relaxed answer grants that permission: one question, a bit of tidy data, a pattern spotted honestly, and an interpretation you can act on. Everything else in this guide elaborates that spine without replacing it.
You Already Do This Every Day
Here is a reassuring truth about whats a data analysis: you almost certainly do it already, just informally. When you glance at your step count for the week and notice you move less on rainy days, that is a small analysis. When you compare recipe reviews before cooking, that is another. Everyday life is full of casual versions of whats a data analysis.
Seeing this makes the idea far less scary. You are not learning an alien skill from scratch; you are putting a little more structure on sense-making you already practice. The formal version simply adds clearer questions, tidier data, and better tools to the intuitive habit. When you wonder whats a data analysis, remember you have been doing lightweight versions your whole life, and the leap to doing it deliberately is smaller than it looks.
Dashboard-centric workflows sit within the broader Wikipedia business intelligence overview, which describes how organizations scale the same instinct—turning data into decisions—across teams and systems. Your casual version is the same instinct at personal scale.
The Basic Recipe Anyone Can Follow
If you want a simple recipe for whats a data analysis, here are the steps in plain language. First, pick a question you actually want answered. Second, gather the information that might answer it. Third, tidy it up, fixing obvious mistakes so you can trust it. Fourth, look for patterns. Fifth, figure out what it means and, if useful, tell someone.
That recipe is the basic version of whats a data analysis. Notice how ordinary it sounds; no step requires a degree or a fancy tool. Following this recipe on a real question is the fastest way to turn idle wondering into actually doing one. The same simple recipe scales up: professionals use a more rigorous version of these exact steps, so learning the casual recipe puts you on the same path they follow.
For step-by-step depth on each stage, see the data analysis process guide in this pillar. The process article names the same stages with more precision; this article keeps them friendly.
Casual Versus Formal Approaches
Not every question needs enterprise rigor on day one. The table below contrasts how whats a data analysis looks when you are starting casually versus when stakes and scale demand more structure.
| Dimension | Casual starter approach | Formal analytical approach |
|---|---|---|
| Question | Personal or small-team curiosity | Tied to a budget, policy, or KPI |
| Data volume | Dozens to hundreds of rows | Thousands to millions of rows |
| Cleaning | Fix obvious typos by hand | Documented, rerunnable rules |
| Methods | Counting and comparing | Statistics, models, governed pipelines |
| Tools | Notebook, spreadsheet, plain-language agent | Warehouses, scripts, audited workflows |
| Audience | Yourself or a friend | Executives, regulators, the public |
| Proof standard | "Good enough to act on" | Reproducible, peer-reviewable |
The casual column is not inferior—it is the right entry point. Most professionals began by answering a small question with a spreadsheet. Whats a data analysis at the casual level teaches the loop; formal work adds safeguards when wrong answers become expensive. Returning to whats a data analysis after your first attempt usually means asking a slightly harder question with the same five steps—not learning a different subject entirely.
Practical example: a neighborhood café manager wondered why Tuesday afternoons felt slow. She tallied register receipts by hour for three weeks, noted weather and nearby events in a simple column, and compared averages. Rainy Tuesdays averaged 41% fewer transactions than dry ones; a nearby university exam schedule explained another dip. She shifted staff hours and tested a rainy-day pastry promo—recovering roughly eight hours of labor misallocated each month. That outcome mirrors what Harvard Business Review's skills-based hiring research describes as increasingly decisive: demonstrated ability to turn information into a decision, not credential signals alone.
What You Do Not Need to Start
Part of answering whats a data analysis is clearing away myths that scare people off. You do not need advanced math; simple counting and comparing handle most casual analysis. You do not need to code; a notebook, a spreadsheet, or a plain-language analytical tool all work fine.
You also do not need a fancy job title or a data background. The activity belongs to anyone curious enough to ask a question and look at information for the answer. Believing you need special qualifications is the main thing that stops people from trying. Whats a data analysis is open to everyone; the barriers are mostly imagined. Start with what you have, and add tools and techniques only as your questions genuinely call for them.
Trying One Yourself This Week
The best way to truly understand whats a data analysis is to try a tiny one today. Pick a small question about your own life—how your mood tracks with sleep, which day you spend the most, whether a habit is sticking. Gather a little data over a few days, tidy it, and look for the pattern. Finishing one turns the abstract question into a lived experience.
Keep your first attempt small and fun rather than ambitious. The goal is to complete the loop once, from question to answer, so the process becomes familiar. In 2026 you can ask a plain-language analytical tool your question and watch it work through the steps—a gentle way to see whats a data analysis in action without writing code. Once you have done one, the mystery evaporates, and bigger questions become approachable because you have felt the process work. That first completed loop is often the moment whats a data analysis stops feeling abstract and starts feeling like a habit you can repeat.
Growing From Curious to Confident
Once the casual version clicks, you may want to tackle questions where the answer actually matters to a decision. Instead of a fun fact about sleep, you might analyze which commuting route is reliably faster, or whether a side project is profitable once you count your time. These questions reward a bit more rigor, and rising to meet them naturally builds confidence.
A good progression is to gradually take on questions with real stakes while keeping the friendly recipe. The same five steps carry you forward with more attention to gathering the right information and tidying it properly as consequences rise. Each slightly harder question you finish expands what feels approachable. Before long, vocabulary from the formal field starts to feel like a description of things you already do.
As confidence grows, tools can grow with you. A spreadsheet that served your first casual questions can take you surprisingly far; when you outgrow it, plain-language agents and guided tutorials bridge the gap. There is no sudden leap from casual curiosity to capable practice—only a series of small, satisfying steps. Keeping the process friendly and finishing each question you start is what turns idle wondering into a genuine skill you can rely on whenever a question matters. Explaining whats a data analysis to someone else after you have finished one yourself is one of the fastest ways to cement what you learned.
Starter Readiness Scorecard
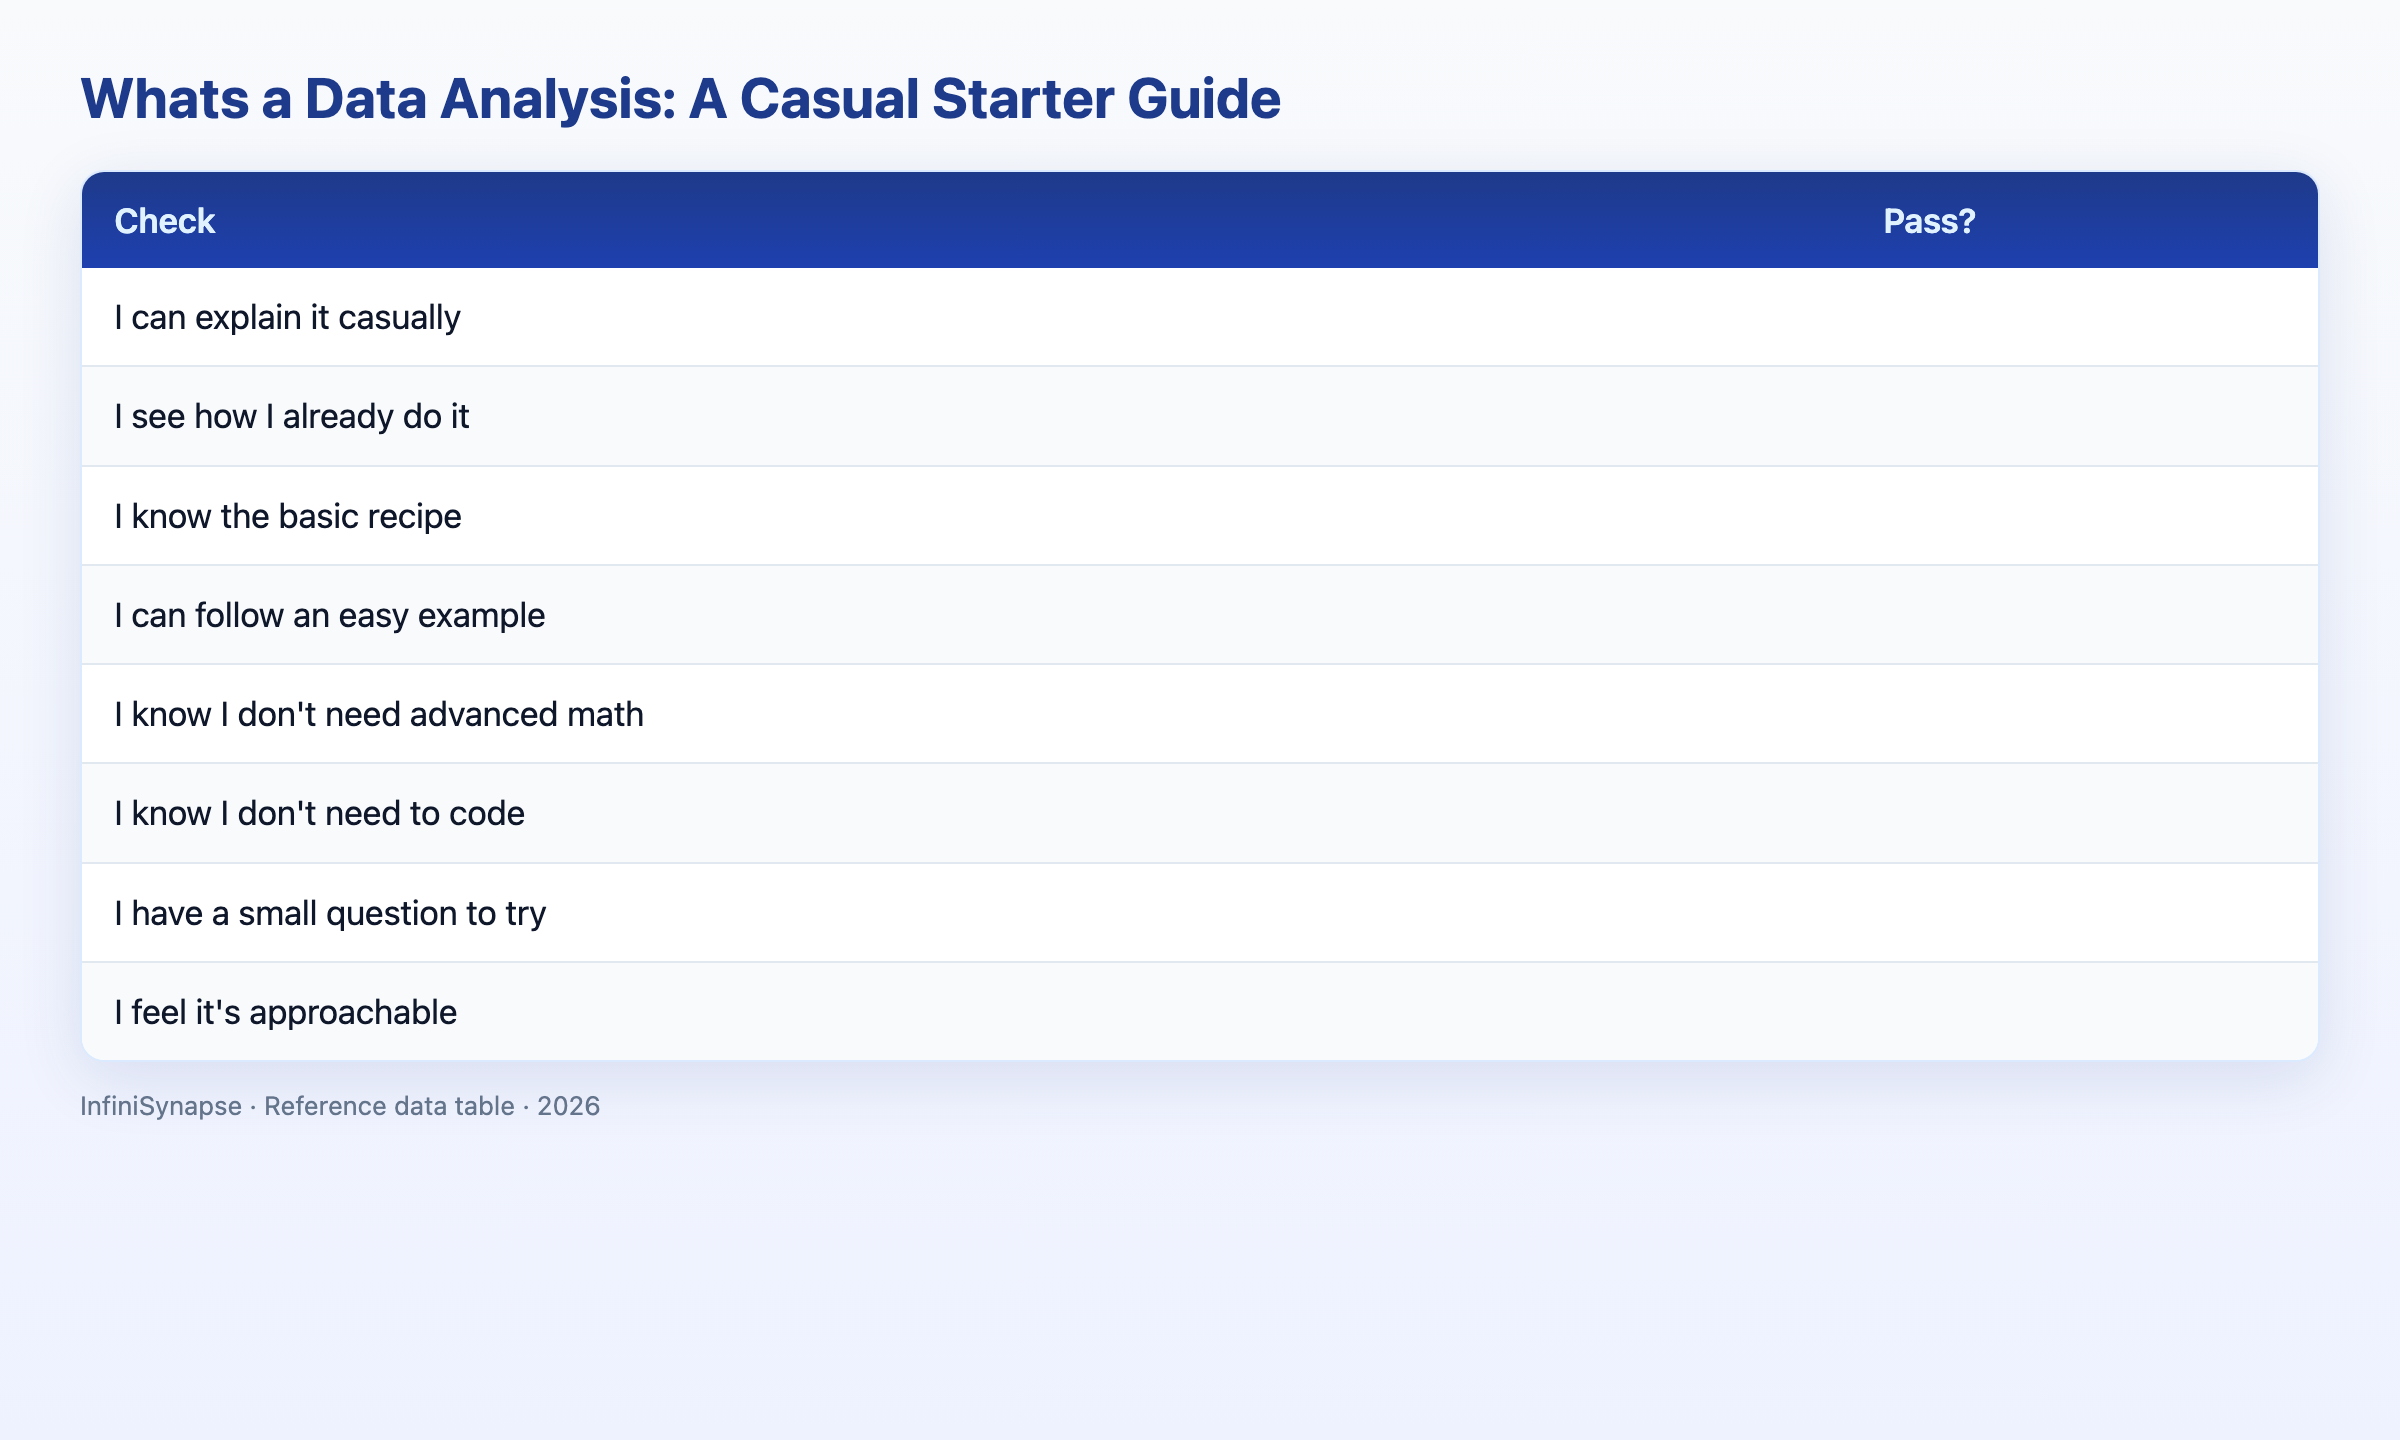
Check your casual understanding (1 point each):
| Check | Pass? |
|---|---|
| I can explain it casually to a friend | |
| I see how I already do it informally | |
| I know the five-step basic recipe | |
| I can follow the café hour example | |
| I know I do not need advanced math | |
| I know I do not need to code | |
| I have a small question ready to try | |
| I feel the idea is approachable |
6–8: you have the spirit—try a real question this week. 3–5: reread the relaxed answer and recipe. Below 3: revisit "you already do this" with one daily example in mind. Passing this scorecard is a practical sign you can explain whats a data analysis without reaching for jargon.
Practical Next Steps
Verify against real job postings
Before committing time or budget, pull five recent job postings in your target market and list the SQL, visualization, and communication skills each repeats. If you are learning whats a data analysis means in practice, align your first projects to those posting patterns rather than a generic syllabus.
Ship one portfolio artifact this month
Employers hire on demonstrated ability. Publish one finished whats a data analysis walkthrough — a clear question, simple charts, and a short summary — even before you tackle advanced tooling.
Frequently Asked Questions
What does it mean in plain terms?
In plain terms, it means looking at information carefully to answer a question you care about. You pick a question, gather relevant facts, tidy them, look for patterns, and figure out what they mean. It needs no jargon, and you likely do casual versions already when comparing options or tracking habits.
Do I need to be good at math?
No. At the casual level, curiosity and simple counting or comparing matter more than advanced math. Everyday analysis relies on clear questions and a careful look at the information. Advanced math exists for harder questions, but you can do plenty of useful work without it.
Can I do one without coding?
Yes, easily. You can work in a spreadsheet, a notebook, or with a plain-language analytical tool—none of which require coding. Coding helps with bigger or more complex tasks, but casual analysis needs no programming to get real, useful answers.
What is an easy first example?
An easy first example: to see if you sleep better without late screens, note for two weeks whether you used screens late and how rested you felt, then compare the pattern. If screen-free nights left you more rested, that is your answer—a complete question-to-insight loop.
How do I try one myself?
Pick a small question about your own life, gather a little data over a few days, tidy it, and look for the pattern. Keep it small and fun to complete the loop once. You can also ask a plain-language tool your question and study how it structures the work.
Conclusion
So whats a data analysis? Looking at information carefully to answer a question, using a friendly recipe of pick, gather, tidy, spot patterns, and interpret. You already do casual versions, you need neither advanced math nor coding to start, and trying one small question today is the best way to make it click.
When you are ready for more structure and modern tools, read what is data analysis and what AI-native data analysis means, then try the InfiniSynapse web app free on registration.